A PIX debugging session
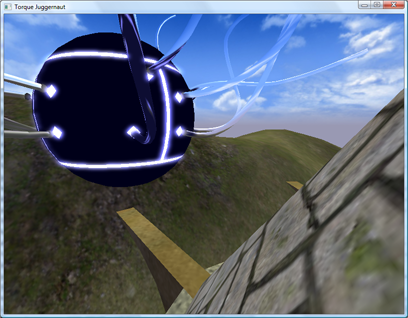
Here’s an article I’ve been meaning to write for a little while. It’s about PIX, the DirectX utility that ships with the DirectX SDK. It’s a great utility for tracking down rendering issues. The point of this article isn’t really to explain it in great detail, because it’s easy to use. It’s mostly to expose people to the tool and encourage you to check it out! This is a debugging session I did after tracking down a crash bug in dynamic cubemaps in the upcoming TGEA release. The crash bug was pretty easy to find. But when I fixed it, I got this result:
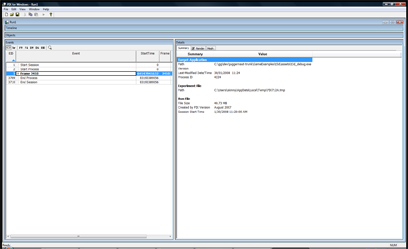
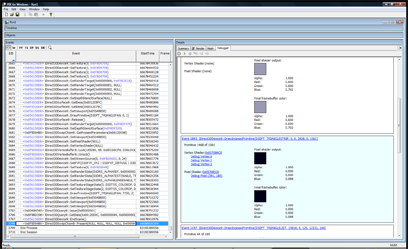
The “spider ball” in this image should be reflecting the tower it is next to, what gives? Let’s use PIX to figure it out. First, to launch PIX, find it under DirectX Utilities under the DX SDK folder. You’ll get a blank screen. Next, select File->New Experiment. Then for “Program Path”, enter the path to your executable. Then, select the “A single-frame capture to Direct3D whenever F12 is pressed.” radio button. Finally, hit the “Start Experiment”. This will launch the app. The next step is to get your app to render your bug. In this example, I moved the camera so I was looking at the spider ball again and hit the F12 key. The game will pause while PIX records all of the DirectX API calls and state into a log file. Then quit. You’ll end up with a screen like this:
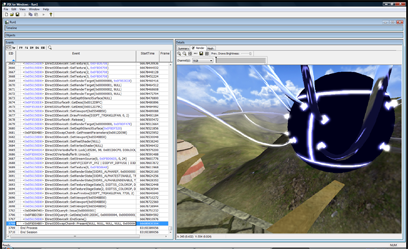
The treeview in the lower left pane is a list of all DirectX calls made during the frame that was recorded. If you click on the render tab in the right pane PIX will show you the scene up to the API call selected in the left pane. You can learn a lot about how an app renders by just hitting the “D down” button and watching the scene draw step by step in the render pane.
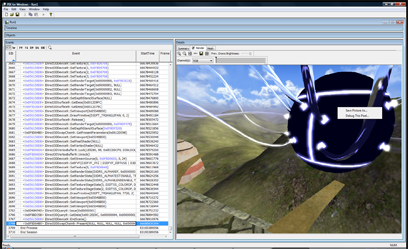
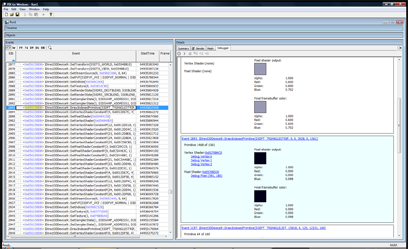
It’s cool to have all of this information at our fingertips, but it’d be cooler if we could filter it down to what we’re interested in. By right-clicking on a pixel in the scene and selecting “Debug This Pixel” we can do just that.
This will replace the render view with a list of all of the API calls that changed the color of that pixel. It’s a life story of that pixel for that frame. You can click on each of the links displayed to move the current selection in the treeview in the left hand pane to that API call.
In this next image, I just picked the first pixel that was black, which should get me to the API call I feel is generating the wrong image. It’s event 2893.
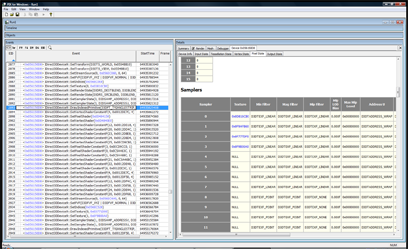
Now we can examine the state of D3D at the time of this call. This is awesome stuff! Rendering with DirectX (and OpenGL) basically involves setting up a large state machine. The types of states are rendering states, textures, texture sampling states, shaders, shader constants, and the list goes on. If any one of these states is incorrect, you’ll get rendering bugs. They can be hard to track down without a tool which allows one to examine the state of D3D. Often we have to do ad-hoc state checks by dumping textures to disk or querying the device and logging the state info out to a file. PIX provides the ability to check state without modifying your code. Getting back to my dynamic cubemap problem, the first question we must answer is: Is the dynamic cubemaptexture being rendered correctly? If it is being generated correctly, are we actually using it during the draw call? Let’s find out! Double click on the blue hexadecimal address to the left of the API call in the treeview in the left hand pane. In this example, it’s 0x056150D8. This will change the right hand pane to a view of the device. We can see a lot of state here. I want to look at the textures, so I choose “Pixel State” from the tabs and scroll down to the “Sampler” section. This section allows one to look at all of the current textures that are active during a draw call. Many bugs are just due to the wrong texture being bound, or no texture is bound at all!
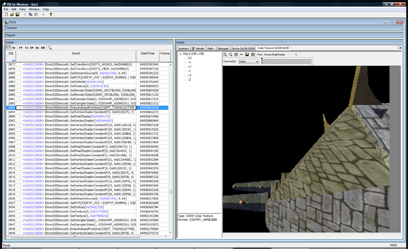
To actually look at the texture, just double click on the blue hexadecimal address in the “texture” column. In the next picture, you can see the cubemap texture has data in it! This is good news, that means I can ignore all of the code that deals with generating the cubemap.
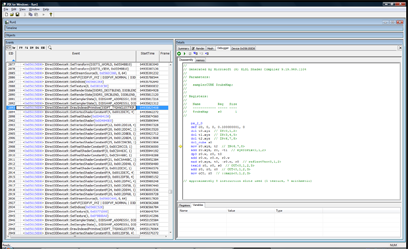
Next, I wanted to look at the pixel shader code that is used. Mostly because I forgot how the cubemap was working at the time. I wanted to see what other dependencies it might have: other textures, shader constants, etc. To do this, go back to the debugger frame that showed the history of the pixel and click on “Debug pixel (xx,xx)”. This will bring up the pixel shader that was used.
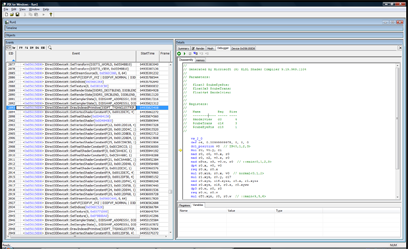
Looking at the shader, it only samples the cubemap and doesn’t rely on any shader constants. It’s time to look at the vertex shader to see what it passes to the pixel shader. To do this, just select “Debug Vertex X” in the history view.
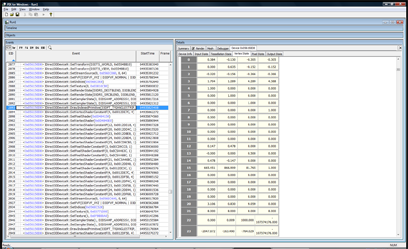
Looking at this dump really fast, I could see that it needed to have these vertex shader constants: $modelview @ position 0, $cubeTrans @ position 16, and $cubeEyePos @ position 19. Let’s check the vertex shader constants and see if the data is good. To do this, select “Vertex State” from the tabs and scroll down to the vertex shader constants.
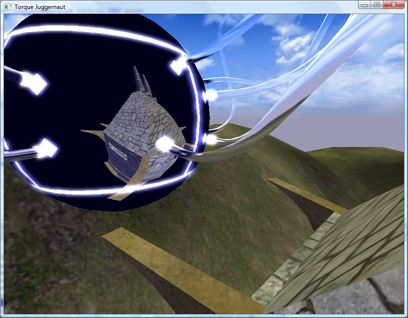
Oh crap! Look at positions 16-19, it’s full of zeros. So the cubemap transform isn’t getting set! I quickly searched the code to see what sets them up and found out that they’ll only be set if the material has “dynamicCubemap” set to true! D’oh! I fixed the material and got the following screen:
That was literally my debugging session, it took about 5 minutes. It could have taken a lot longer if I didn’t have the right tool. Hopefully, this was a good introduction to PIX. There are other uses for it: performance monitoring, resource usage, but this is what I use it for the most. I hope this article makes you reach for PIX the next time you have a rendering bug.
