Posts
Book Report: Book and Dagger
A recommendation from my friend Jared.
I slacked off on writing notes for this one. It was well written and a really fast read.
This is a book about the beginnings of the intelligence service in the US. A man named Donovan was asked by Rosevelt to bootstrap this service because it didn’t exist. This service was named the OSS: Office of Strategic Services. Donovan, a lawyer, filled this with scholars from all fields. Including many fields that traditionally didn’t not do intelligence work. They were able to get information from unconventional sources: newspaper clippings, family photos, etc.
Read more →Book Report: Julia
After finishing 1984 again, I finally read Julia. It was a really good read. Read more for a poor summary. ;)
Read more →Book Report: 1984
Context
I heard about Julia which is 1984 from the perspective of Julia, the other main character in 1984. I decided I wanted to re-read 1984 before reading Julia so I could appriciate it more. I last read 1984 when I was in late elementary or early middle school. So I definitely didn’t remember details, but did remember the general gist of things at least. I wrote the below on my phone at varying levels of detail. Something to improve with these book reports.
Read more →Book Report: Taqwacores
I’ve been trying to take notes as I read books now. I tend to totally forget what a book was about a few months after I read it. This is an attempt to counter that a bit.
My friend Karl mentioned he had read this book, so I decided to give it a go. I’m stoked I did.
Read more →Shows I saw March 2024
Drum Blast at Healing Force Records
Ok, this was Feb 17, but it was so rad I wanted to document it. This was three drummers:
- Louis Cole
- Justin Brown
- Roni Kaspi
Basically just doing a jam session. It was super fun to watch these folks trade beats back and forth. (I didn’t take any pics, will get better about this!)
Kontravoid at Lodge Room
Buzz Kull opened and he was fun to watch. Angry screaming dude over some beats with a lot of glitchy visuals projected behind him. Boring description, but it worked for me at the time!
Kontravoid was better than I expected. I was always 50/50 on him, but he put on a good show and I really enjoyed it. So I am now 70/30 on Kontravoid. Highlight was the backing video of him riding a jetski with the mask on (heavily processed of course). Very fun!
Failed to see Javier Santiago at Stowaway
We tried to see this, but the street that the Stowaway was shutdown because the cops were protecting some fancy dinner event that benefited the IDF. Bullshit! After having cops tell me to lie to other cops to get access to the road, we gave up.
Jermaine Paul Quintet
Luckily, Javier was playing with this quintet, so we didn’t miss him fully. This was a show at a space in Sherman Oaks. I forgot who drummed, but I remember really enjoying his work.
Ben Frost at Lodge Room
Totally floored by this show. I didn’t know what to expect. I’m more familar with his ambientish work. For this show, he was working with a guitar player. It seemed like the guitars could trigger percussion samples and Ben Frost was creating the sounds beneath the guitar/percussion combo. It was great! It was loud! It was awesome!
Mononeon at Lodge Room
Mononeon was super fun. His new songs are good, he had a lot of folks up on stage. At one point, there was like 4-6 backup singers.
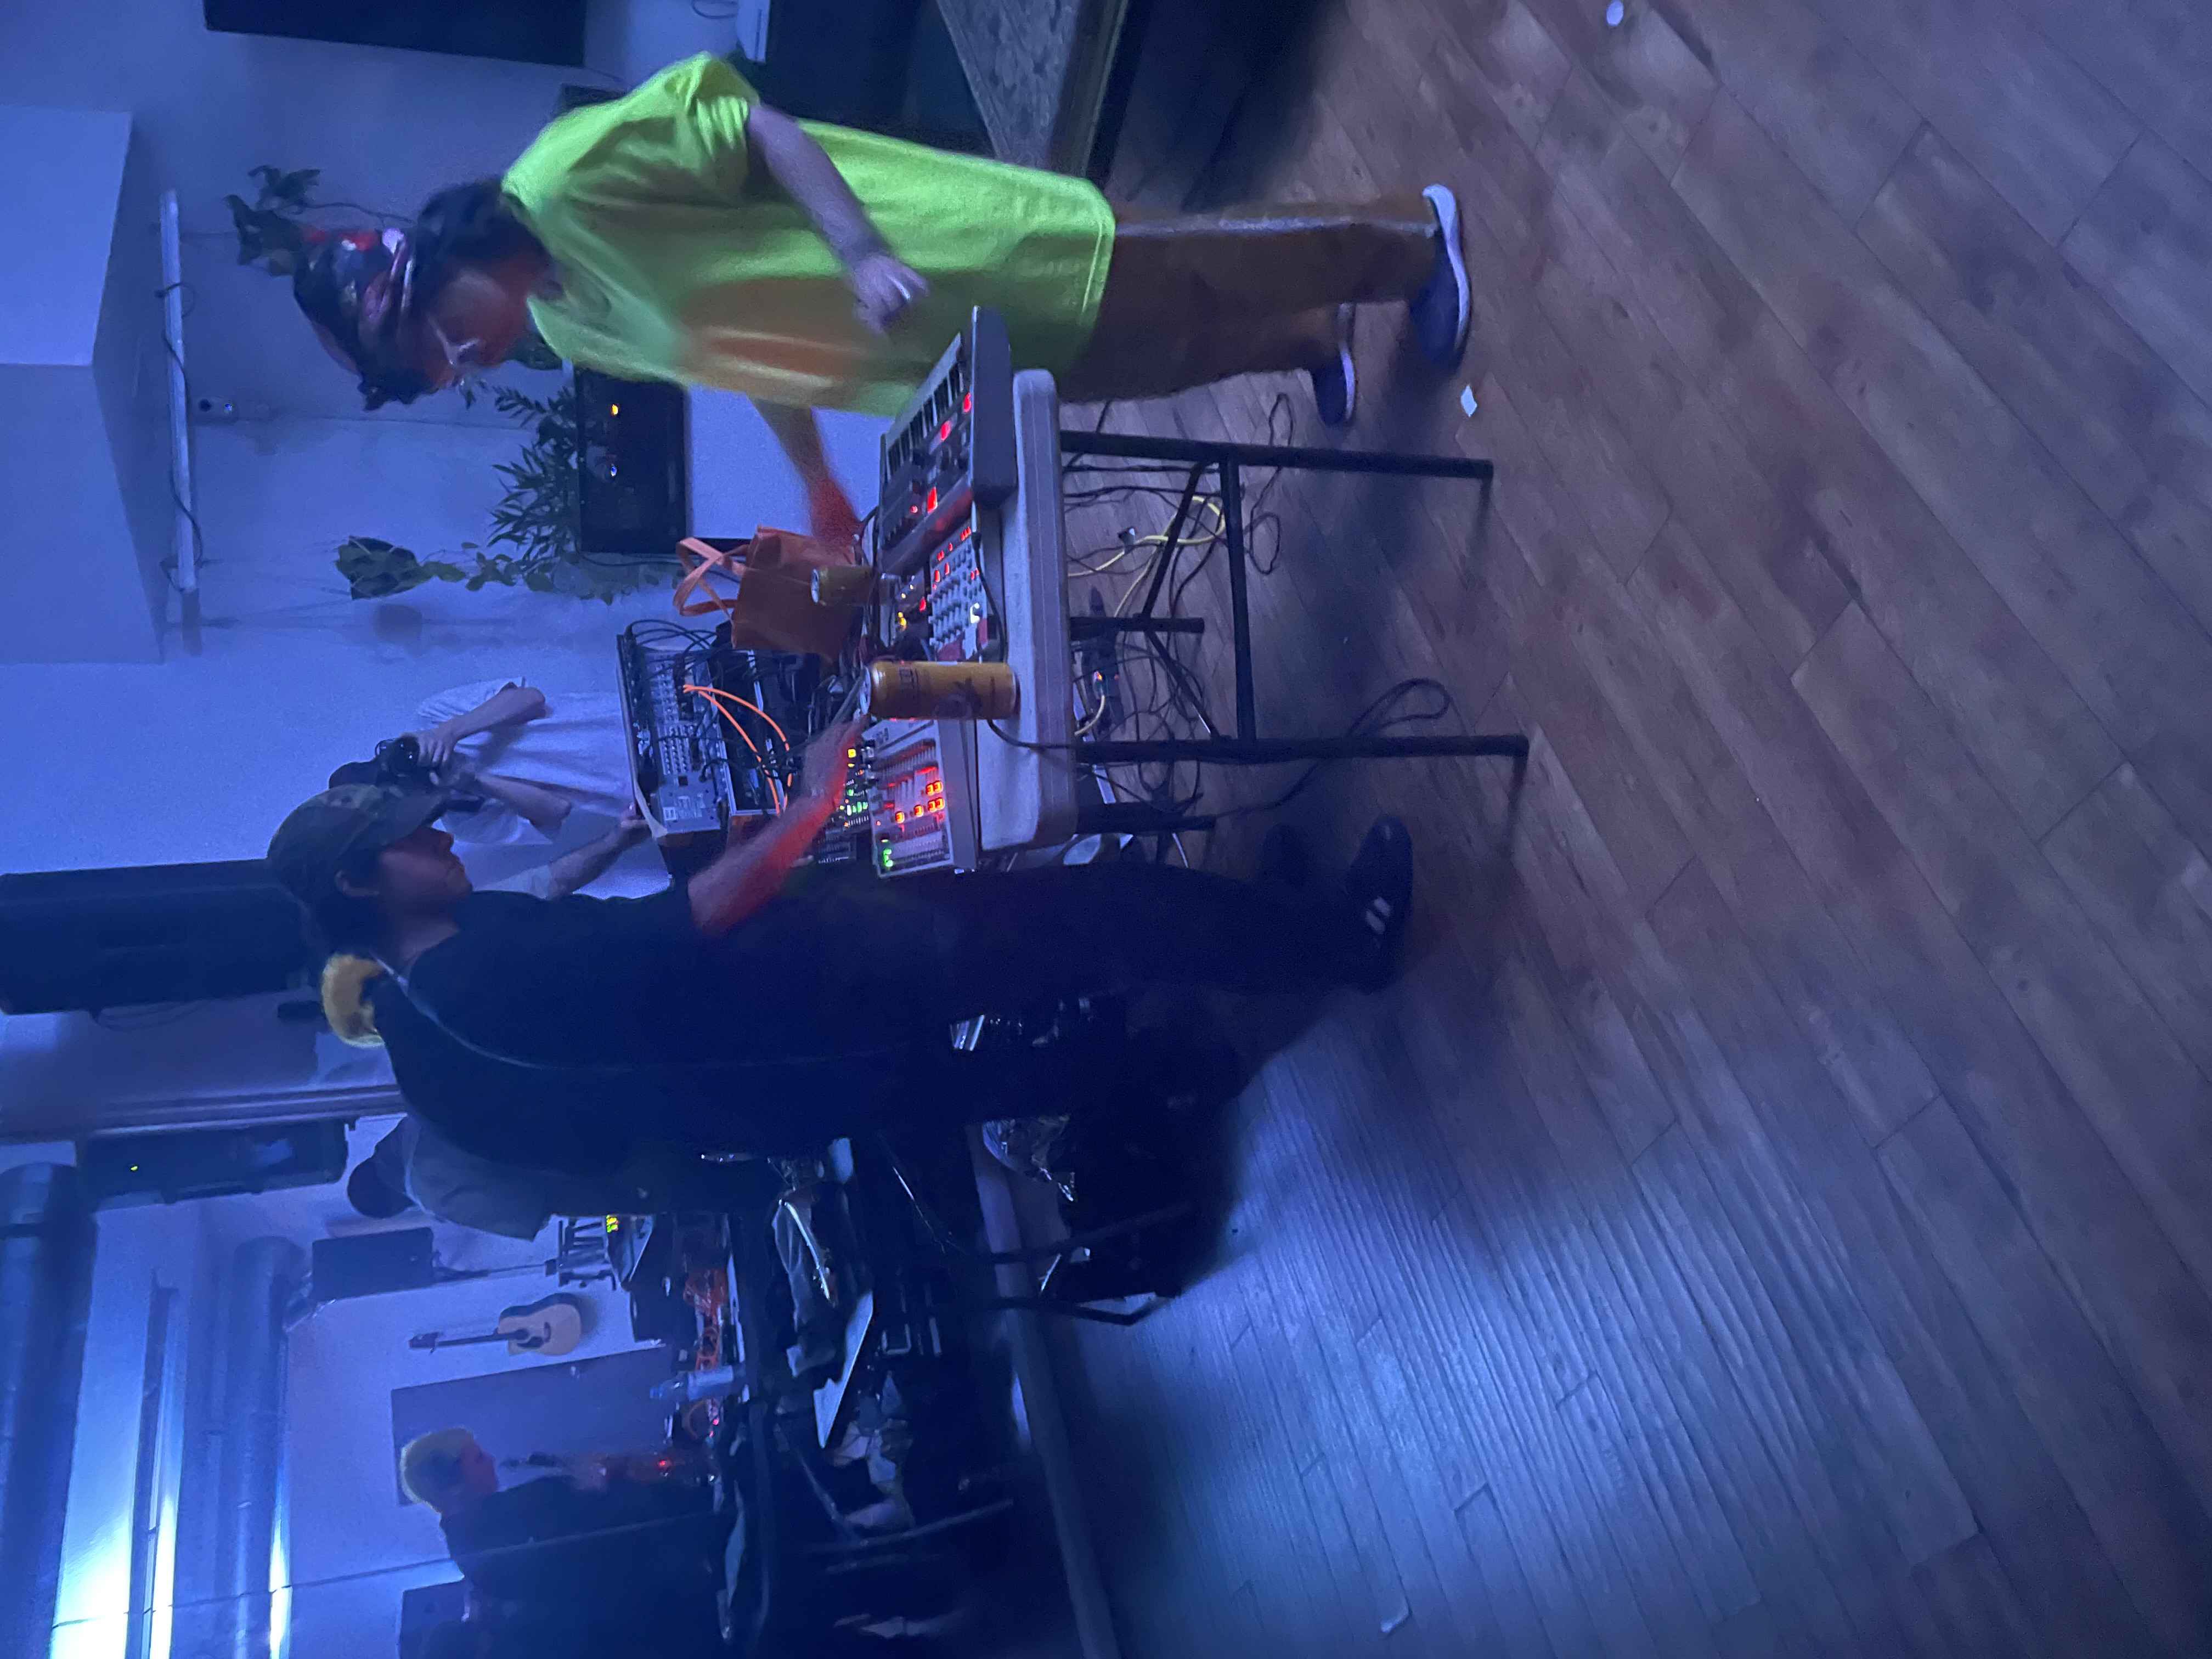
Minaret Show @ Left Method
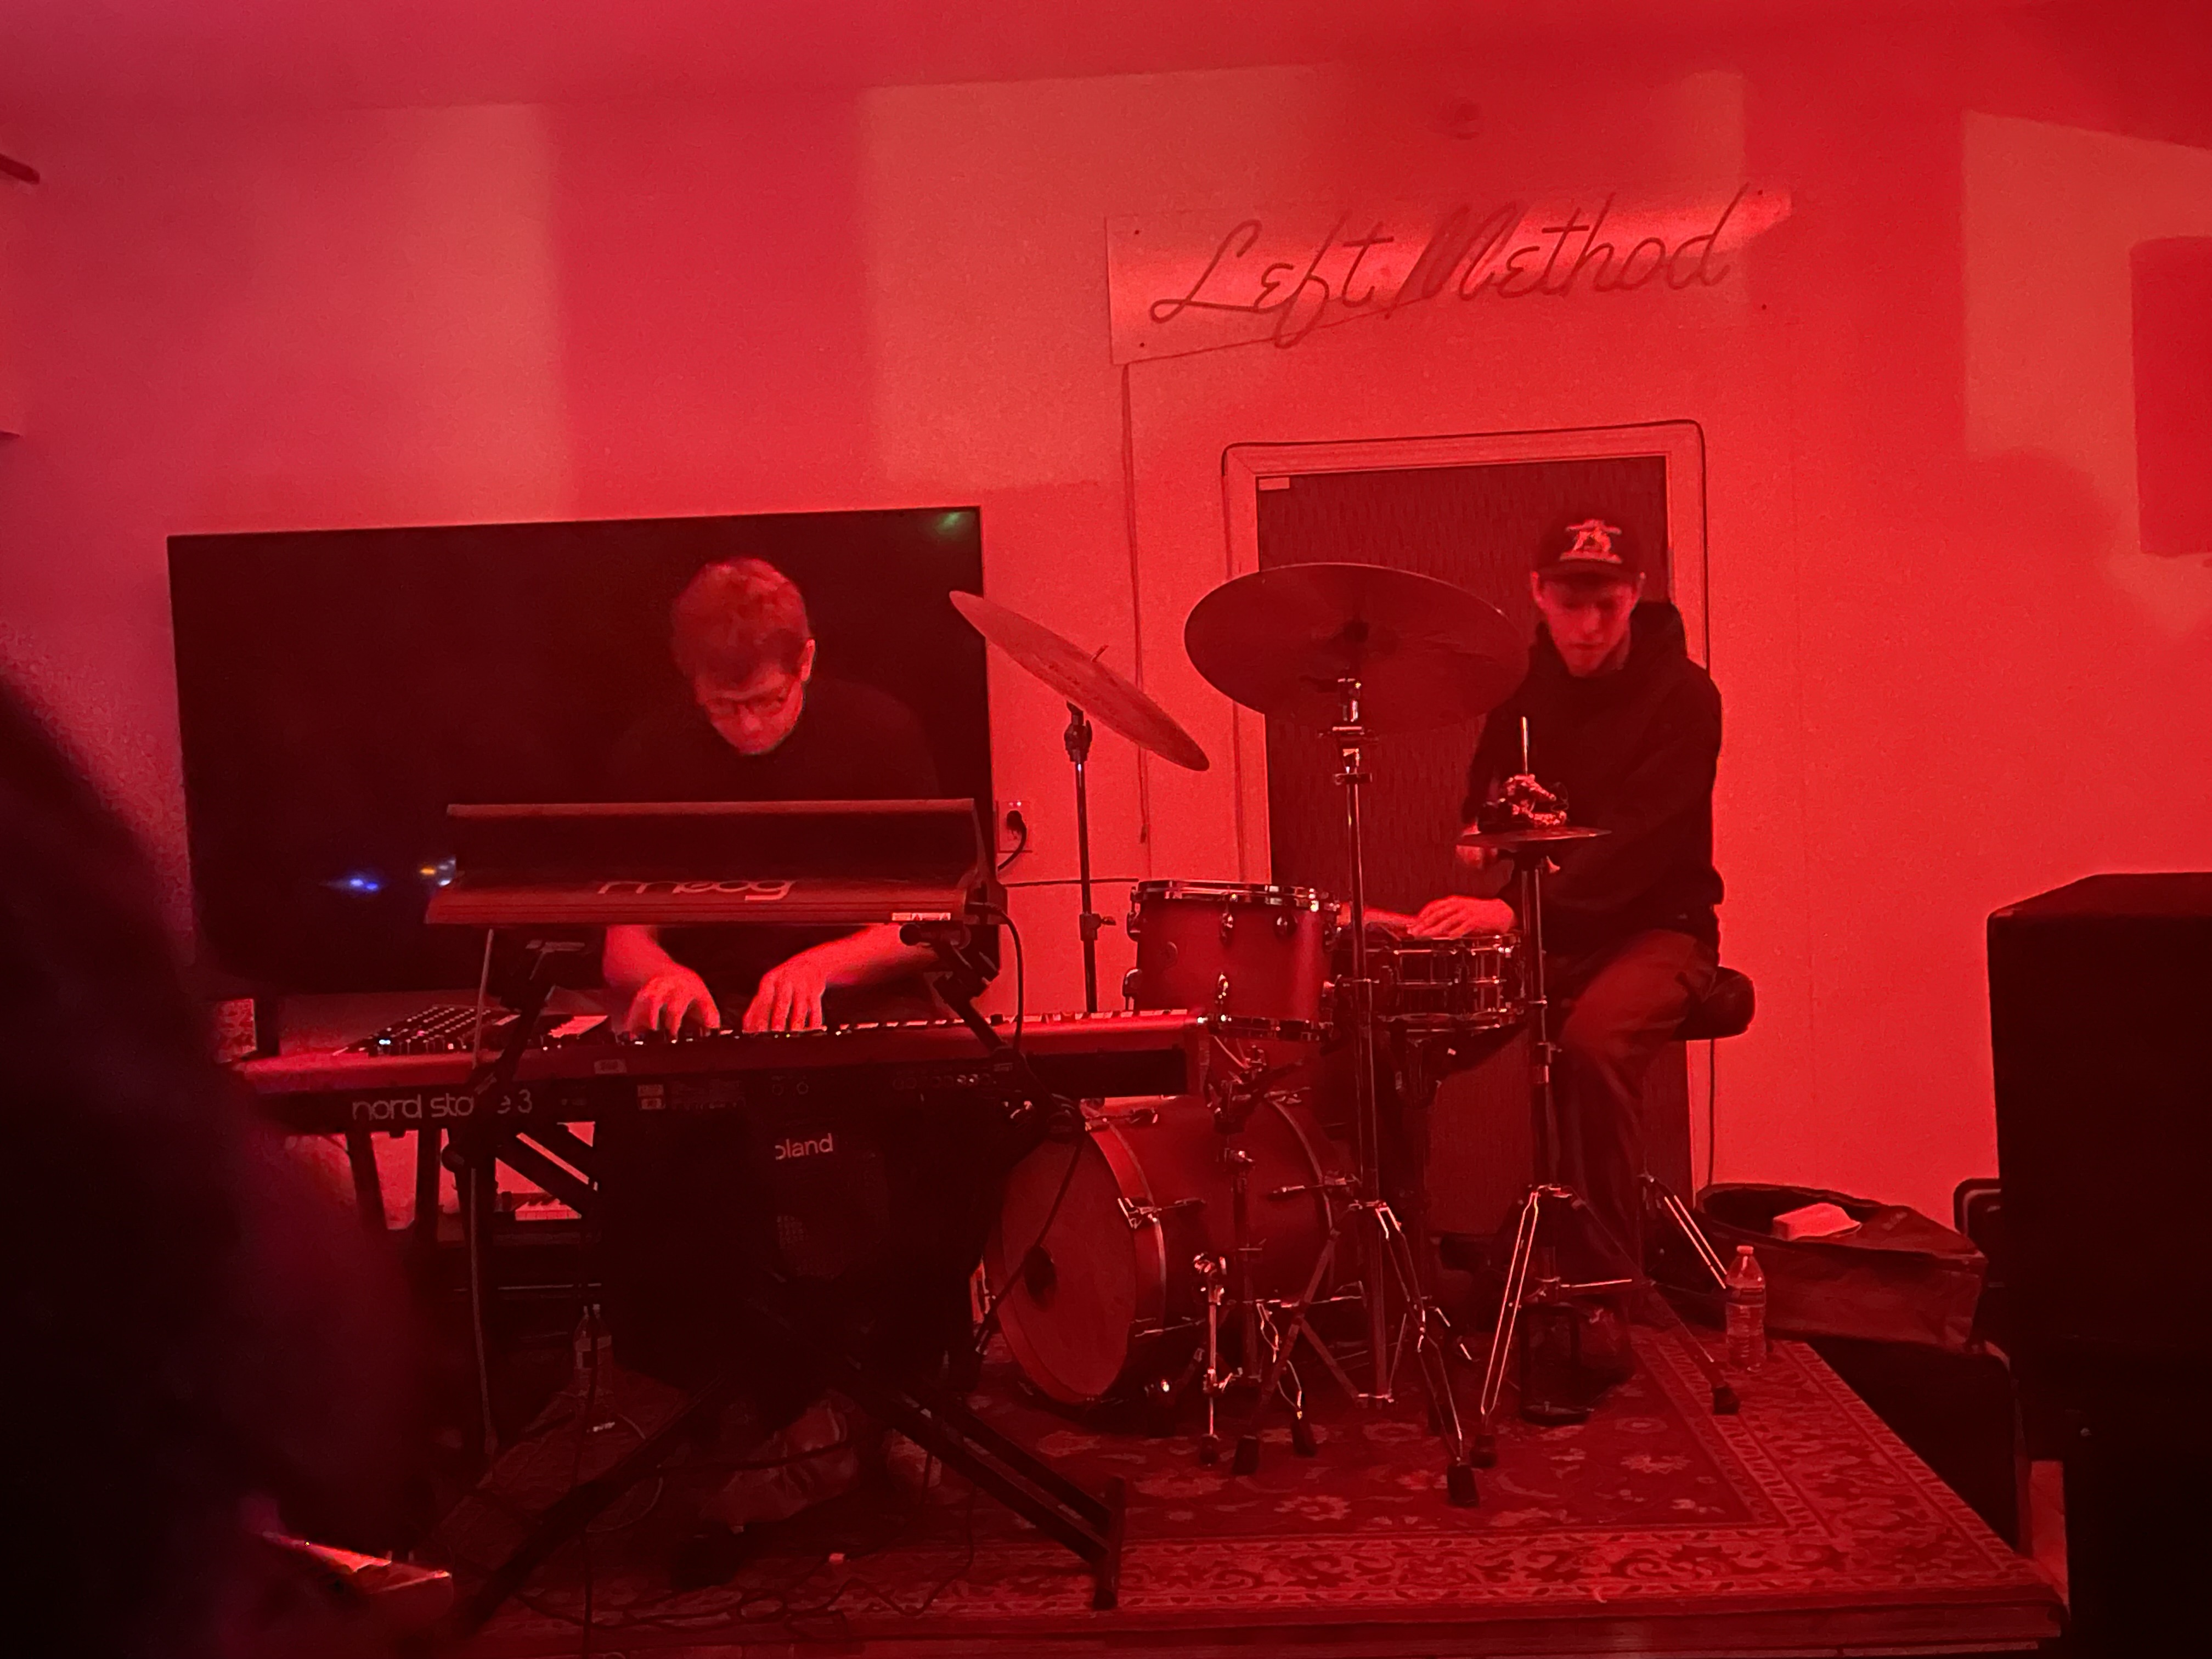
Opened with Luke Titus on drums and Elijah Fox on keys. Luke Titus is definitely in my top 5 list of drummers. I love his style and he can play really fast. I sometimes feel like I’m listening to drum and bass, but then I open my eyes and it’s a HUMAN BEING hitting the drums.
It closed with Henry Solomon, chiquitamagic, Billy Voltage doing a set with synths and saxophone. It worked out pretty well! There were some really cool moments during their set.
Been really enjoying the shows Minaret Records puts on. They are often at venues I’d otherwise never make it to. It feels like a scavenger hunt through a new city to me.
Tsutomu Nakai @ Zinc

Part of a series called ‘Guitar Masters’, which isn’t normally my thing, but I had a lot of fun at this show. Zinc Bar in NYC is a cool space. The drummer was really good. I enjoyed his solos quite a bit!
Hiromi’s Sonicwonder @ Blue Note

We made it to the famous Blue Note in NYC to see Hiromi Sonicwonder do their thing. Hiromi was great on keys. I really enjoyed the drummer, I liked that he gave space to be quiet during his solo.
Webb All Stars @ Baked Potato

I went to this to see Danny Carey hit the drums. I was not disappointed. It was great to see him drum in such a small space. You could see him listening the the music and see how focused he was on what he was doing. It was great. The Baked Potato is a really cool venue, looking forward to going back!
Doctrine of Error
These images were generated with a pretty simple program. It takes an input image and compares it against the current painted image. The program generates a new brush stroke and the new error is calculated between the input image and the painted image, if the stroke reduces the error it is kept, otherwise it is rejected. Final image here
Tank Man – Painted with the Doctrine of Error
I like how this one turned out, the source image of Tank Man was a bit noisy and I think it interacted with the algorithm in a cool way. Final image here.
I wrote this program in Racket. I’ve been meaning to learn a LISP or Scheme based language for a long time. I thought this program would be a fun way to start. The brush strokes use a technique called Globs which basically connect to circles together with splines in a way that it has first-derivative continuity with the circles. It’s a nice way to generate brush strokes. Final image here.
It was inspired by the Create Applications of Deep Learning class and Ben Garney’s blog posts about writing a proof of concept video chat system. In both cases, the technique of defining, measuring, and reducing error is the core concept that makes it all work. Final brain here.
In the future, I’m planning to apply this to video. It’ll be straightforward to take the previous frame of a video and use it as the starting point for the next frame. I think the effect could be cool. I might also port a simple version of this to a more popular language and give a DorkbotPDX workshop on it. Final clocks here.
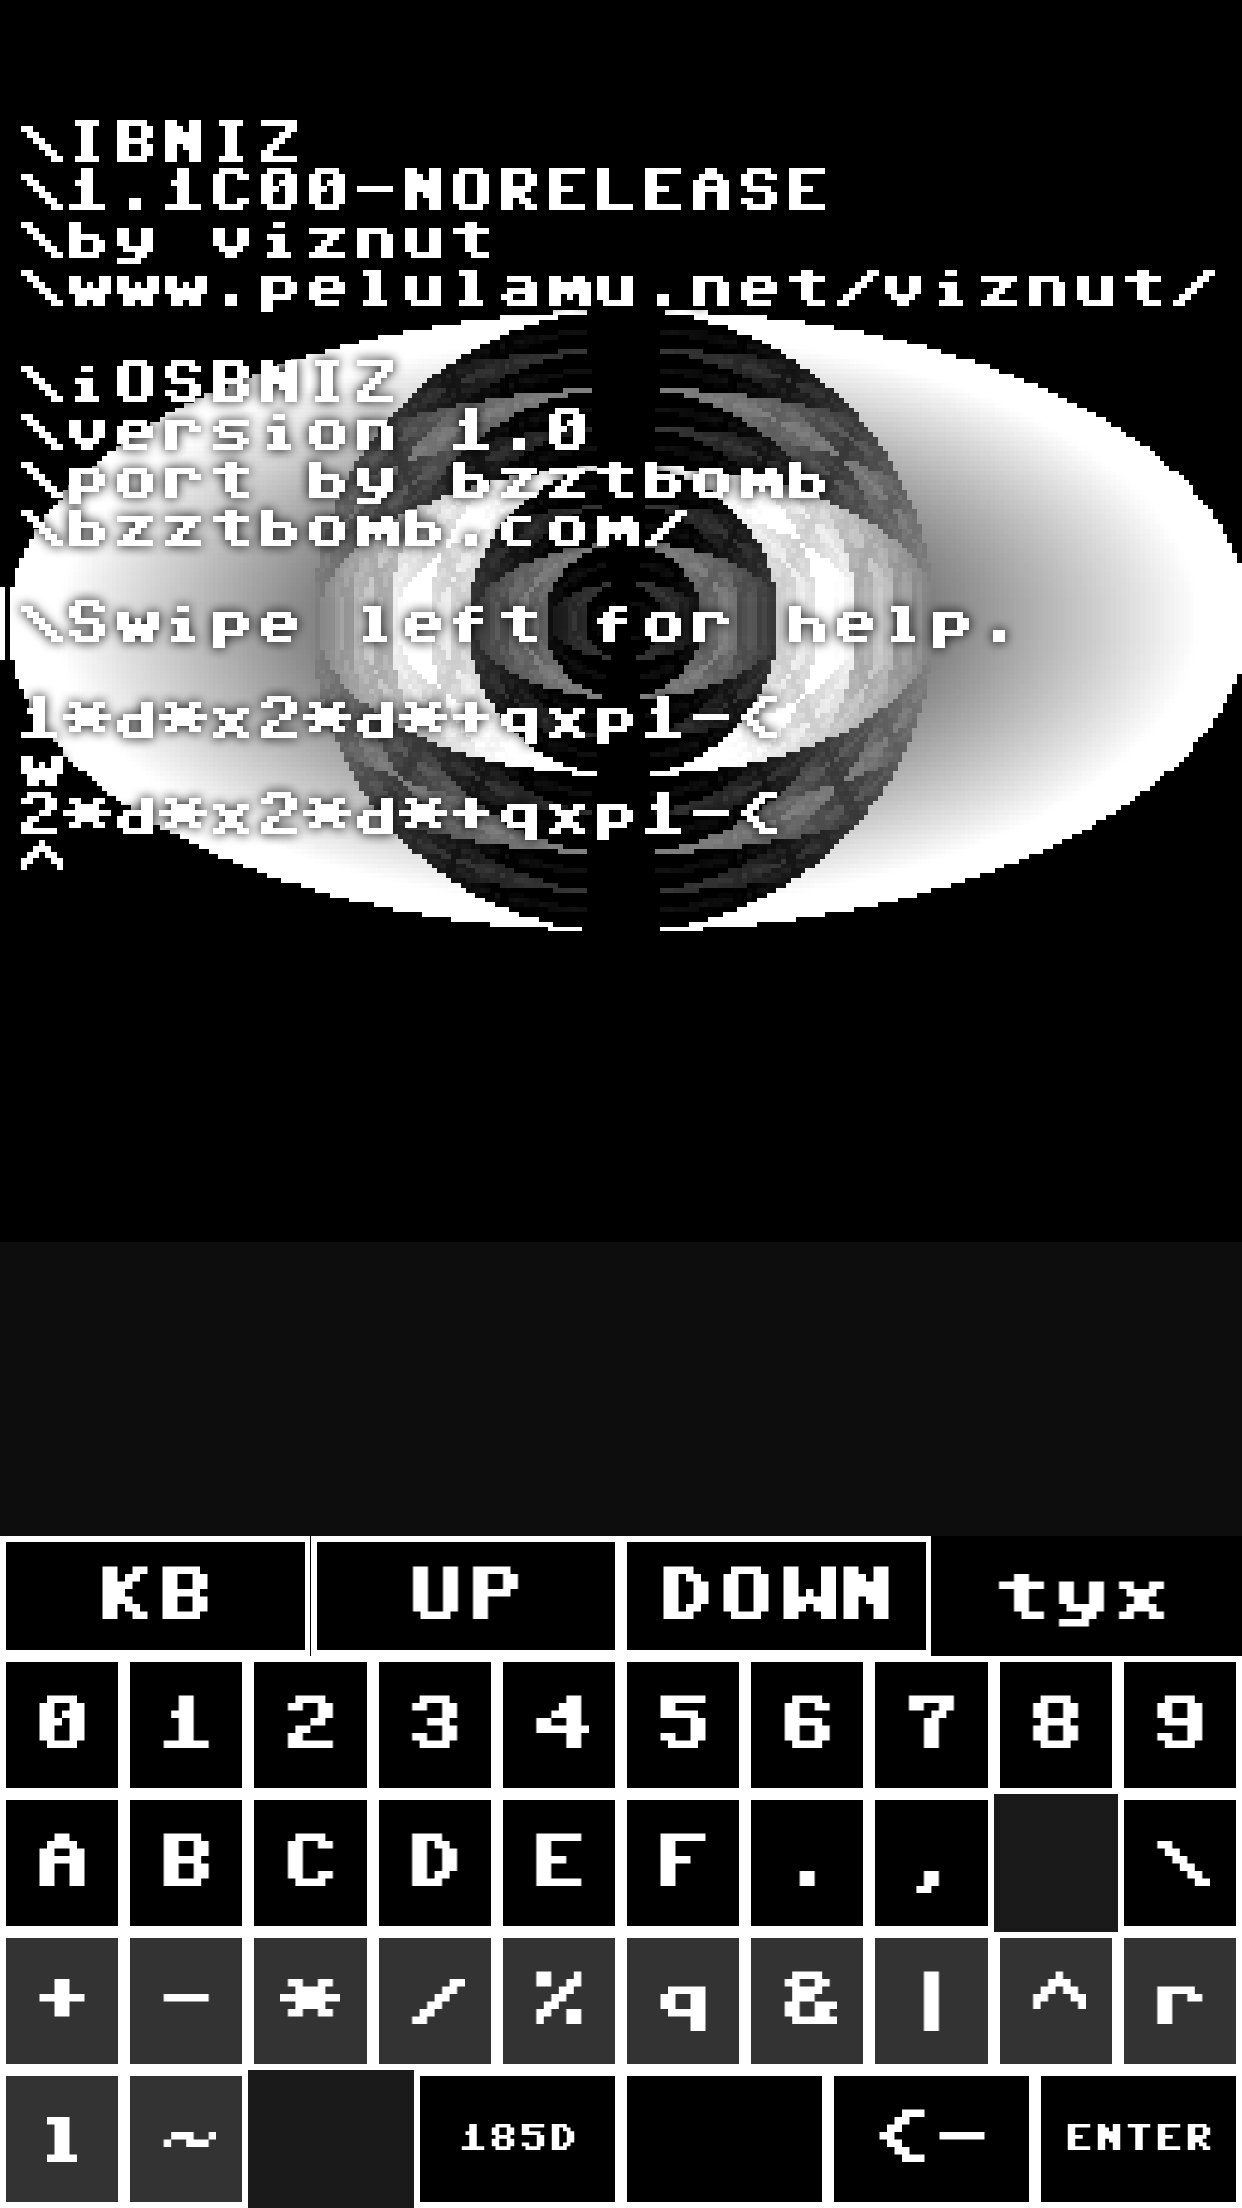
iOSBNIZ
iOSBNIZ is a port of IBNIZ by viznut to iPhone and iPad. This allows me to program little audiovisual hacks on my iPhone with minimal typing. IBNIZ features a VM with opcodes that are one character long, ideal for not hitting too many buttons. It also has a FORTH like stack which is a fun puzzle to play with. The VM calls the program for each pixel and pushes time, x, and y onto the stack. Your program uses these values to generate the visuals (and audio). You can also write a full program and ignore this loop as well.
iOSBNIZ is available on the Apple App Store. Download and have fun!
Source code is avaiable on Github
IOSBNIZ Features
- IOSBNIZ features a keyboard which is tailored for the OPCODE structure of IBNIZ. Characters are grouped together by function.
- Holding a button down on the keyboard will display some HELP to remind you what the opcode is.
- It keeps your last program for fast restarting of hacks.
- You swipe right to display your program without code and swipe left to bring the editor back.
- Swiping left will display help.
- Swiping left again will allow you to save and load programs.
- Shake the phone to switch between swipe mode and “U” opcode mode. In U opcode mode your touch location is sent to the U opcode.
This Is How We Disappear
I’ve been meaning to document my work on this project for about year now. TBA 2014 reminded me it is time to actually do it! So here it is:
For the past year and a half I’ve been working with a dance company called BOBBEVY. I’ve been creating graphics that go along with the dance performance called “This is how we disappear”. Here’s a review at Portland Monthly.
Jesse Meija was doing music and got me involved with this project, I’m very grateful!
Version 1
Effects for the first set of performances:
- A forest of trees created from a drawings by David Stein.
- Particle effects that mimiced the dancers movement.
- Particle effects that just fly across the screen
In order to accomplish this, I wrote a piece of software that would do the animation and handle tracking the dancers. There were two versions, the first version was used to perform a few times. Notably Dance+ in 2012 and as part of Experimental Half Hour XXXVII. It consisted of the following pieces:
- Cinder, used as a framework
- Freenect, used to interface to the Microsoft Kinect.
- Control, used to control the software from an iPad
This version worked ok. Before I started using Control, I had been triggering all of the sequences with keyboard commands. It worked fine, but I had to have a cheatsheet that told me what keys did what. Also, each command just mutated the state of the program, so if you triggered things in a different order you’d end up in different states. This made some rehersals hard, because it was difficult to return the graphics to a previous state. However, with Control, it became easier to use the software. BOBBEVY performed in Milwaukee without me and was able to use the software just fine! For Dance+ the Kinect refused to work in the studio, I think because the temperature in the room was so high. So I ended up “drawing” the dancers with a multi-touch interface in Control.
For the particle effects that followed the dancers, I ended up using blob tracking and distingugishing blobs based on distance away from the Kinect. I liked the stateless design because the dancers would move in and out of view of the Kinect and I feel that keeping track of them properly would have been a nightmare. This created some surprising benefits though. The swarms move between the dancer when their relationship to the Kinect changes and it created some really nice animations. Also, this piece has a lot of tension between the dancers and the particles ended up expressing some tension when the dancers were about the same distance away from the Kinect.
Version 2
Additional effects for the second set of performances:
- Static/simple projection mapped screens (similar to my Party House project).
- Realtime projection mapped patterns on the dancers bodies
This second version of the software was used to perform at NW New Works Festival 2013 and at TBA 2013.
For the second version of the software, I used the following new pieces:
- QTimeline, this is a timeline that allows one to control tweens of variables
- QuNeo, as much as I liked Control using a touchscreen while not looking at it (I had to look at the dancers for my cues!) is not ideal. A physical controller allows you to rest you finger on the button/slider you need to push without triggering it. (The cool kids pronounce it keeen-wah).
- LabMidi, used to interface to the QuNeo
- For TBA, 3, yes 3! Projectors. Two of them were used to cover the wide background, and one was used to project onto the dancers themselves.
The timeline solved many problems for me. It took what I used to have hard code in the application (fade times, animation speed, etc) and moved it to a data format. The editing GUI was nice to have as well. A new version of Cinder that made using multiple displays easier to use was really nice to have as well. I didn’t need to mirror my desktop screen anymore, which meant I could display debug and other helpful info on my screen. The QuNeo also allowed me to directly control ramp parameters which meant I didn’t need to rely on predetermined fades as much. This also allowed me to be more engaged with the visuals which was really fun. I think the trick to this will be finding the right balance between direct control and triggers to presets. It is probably the same balance electronic musicians search for.
The newest effect for the second run was the projection mapped dancers. In order to accomplish this, I was going to have to find the dancers with the Kinect and then project onto them as close as possible. I used the vvvv patch from here as a starting point to learn how to calibrate my projector with the Kinect. In the end, I wrote my own calibration code because it fit the setup workflow a bit better.
The projection mapped dancers worked pretty well. I was really excited to see them turn into just an indistigushable mass at moments and then turn back into dancers the next. I think this is what projection mapping should do: transform objects and confuse you, then bring you back to reality. I hope to do more of this in the future!
Church of Robotron Sermon
On March 25th, 2013 the Church of Robotron gave a sermon at DorkbotPDX 0x0A. It focused on the mobile Church of Robotron installation we did at Toorcamp 2012. James gave live sermons interspersed with presentation snippets about the installation. We projected our faces onto old TV’s, an homage to Dr. O’Blivion and the Wizard of Oz. I mutated the Party House project to support webcams and applying shaders to the input stream. I was able to control the video source and shaders at realtime during the sermon. We also had slides. I think it was a nice mix of a live human being, psuedo live humans being projected, and standard slides. I hope to do more sermons in the future!
NW New Works Festival 2013
Doing live visuals with BOBBEVY this weekend in Seattle, WA as part of the NW New Works Festival 2013. Check it out!
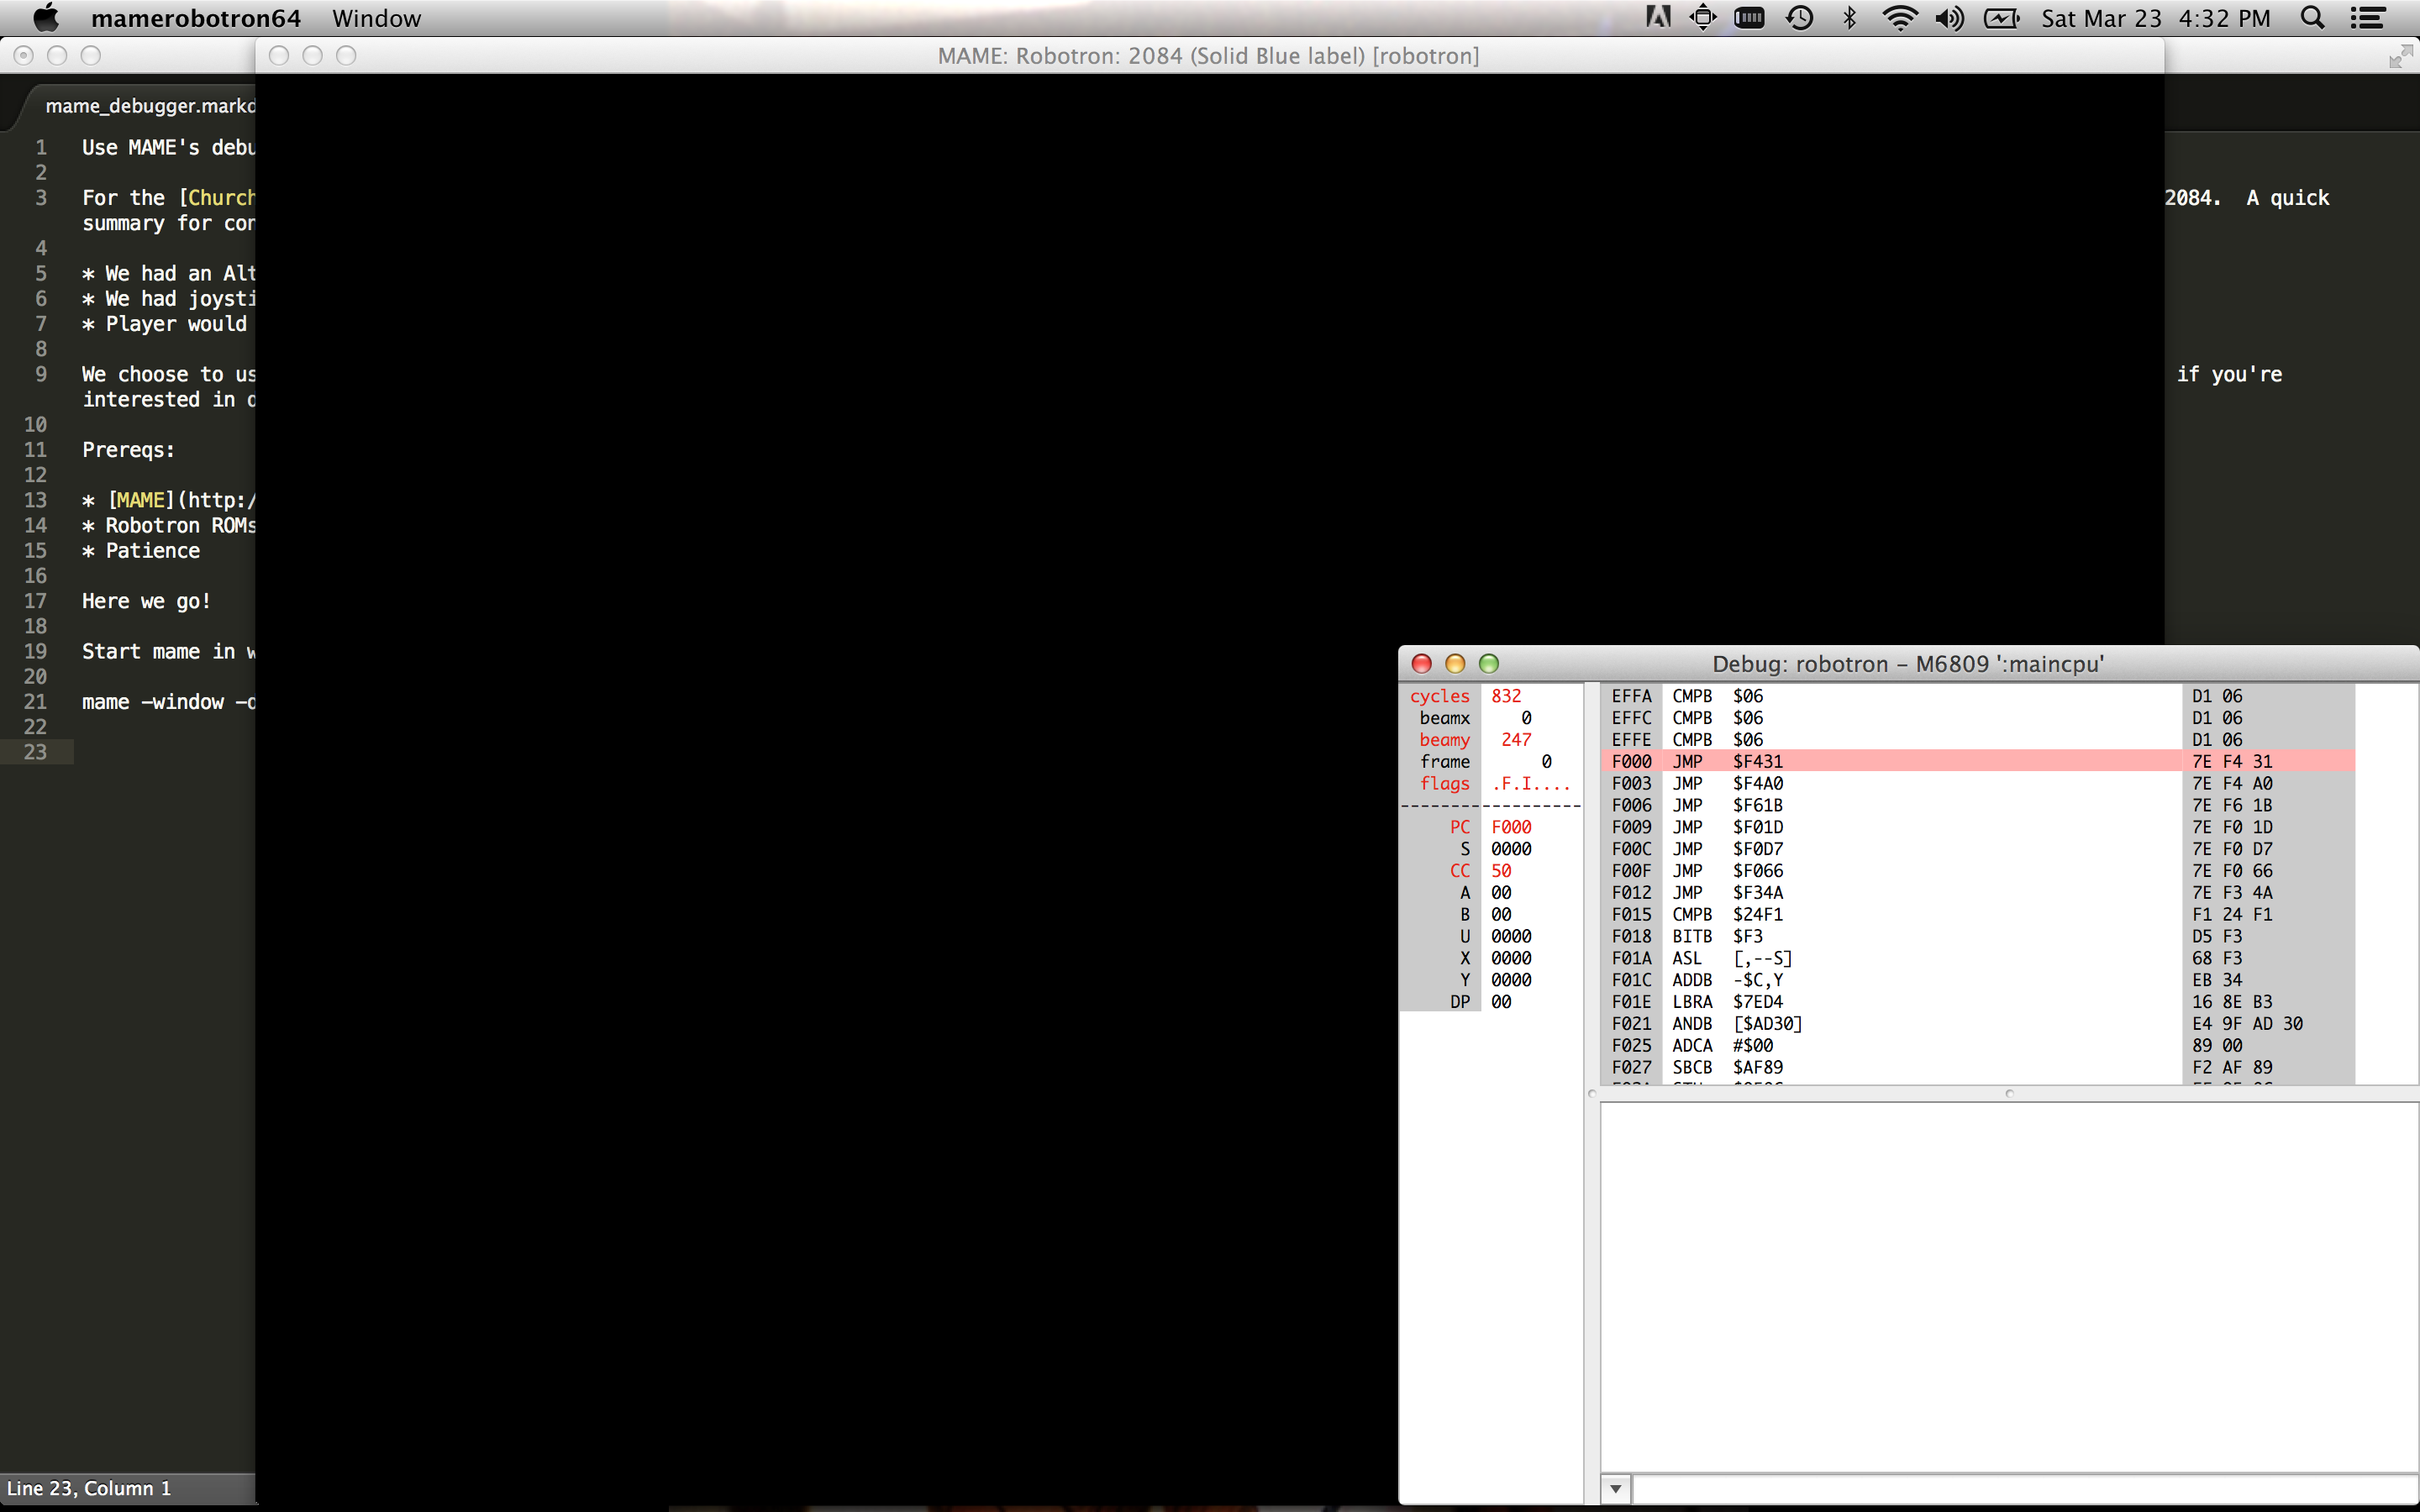
Use MAME's debugger to reverse engineer and extend old games
Use MAME’s debugger to reverse engineer and extend old games
For the Church of Robotron’s installation at Toorcamp 2012, we needed to be able to trigger physical events when game events happened in Robotron 2084. A quick summary for context:
- We had an Altar that contained a Linux box that ran MAME and Robotron 2084
- We had joysticks that acted as HID devices
- Player would kneal down and play the game. As events happened in the game (player death, human death, lasers firing), we would trigger physical events.
We choose to use MAME’s debugger to detect game events and notify other pieces of software when they happened. This is a quick tutorial for others (and a reminder to ourselves) if you’re interested in doing similar things. We’re going to find out how to detect player death!
Prereqs:
- MAME
- Robotron ROMs
- Patience
Here we go!
Start mame in windowed mode with the debugger active:
mame -window -debug robotron
You’ll see two windows appear, one is the emulation, the other is the debugger window. You can type “help” at the console and get good documentation on the debugger capabilities. You can also click on the down arrow to access a menu that allows you to run the emulation and later pause it at different points.
Memory dump
The first thing to do to find the memory location of the number of lives the player currently has. One way to do this is to take advantage of other peoples work. ;) Sean Riddle has a great site with a lot of this information already available! The other way is the manual way. Let’s do that!
- Start the game by hitting F5
- Start playing a game, by hitting 5 to drop a coin, and 1 for one player game.
- Pause the game by hitting F8
- In the debugger console, type “Help Memory”
- Ah, nice, there’s a dump program memory command. Type: “dump lives3.txt,0,0xFFFF”
- Press F5, then click on the emulation screen
- Hit F2 to access the Operator Screens of Robotron.
- Hit F2 until you see “Game Adjustment”
- We’re going to change the default number of lives to 5 and see if we can find the difference in the dump.
- Press “D” to go down to “Turns Per Player”
- Press “I” to change the number of lives to “5”
- Press F2
- Reselect the debugger screen
- Press F8 to pause
- Press the Down Arrow, Select Reset, then Hard
- Start playing a game, by hitting 5 to drop a coin, and 1 for one player game.
- Let the game get to the main screen, then pause the game by hitting F8
- Type “dump lives5.txt,0,0xFFFF”
Now we have dumps of the game with 5 lives and 3 lives as the default. Let’s use a diff tool to see what changed in memory! On OSX, you can use Filemerge or standard old “diff”. Scanning through the differences, we don’t see anything that correlates to 5 lives and 3 lives. But we do see two spots that seem to correlate to 4 and 2 lives:
2722,2727c2722,2727
< AA60:  18 07 FF 06 5F 04 1D AA 58 39 CD 02 00 00 00 00  ...._...X9......
---
> AA60:  18 07 FF 06 43 03 E9 AA 58 39 CD 04 00 00 00 00  ....C...X9......
This address is AA6B.
3039c3039
< BDE0:  00 00 00 00 00 00 01 00 00 02 50 00 02 01 14 0A  ..........P.....
---
> BDE0:  00 00 00 00 00 00 01 00 00 02 50 00 04 01 14 0A  ..........P.....
This address is BDEC.
Setting watchpoints
Let’s see if we can test our guesses!
Go back to the debugger:
- Type “help watchpoints”, a Watchpoint will cause program execution to stop whenever a memory address is written to or read from.
- Find out more info on setting a watchpoint by typing “help wpset”
- Let’s set our watchpoints
- Type “wpset 0xAA6B,1,w” This will set a watchpoint that is triggered whenever our first memory address guess is written to
- Type “wpset 0xBDEC,1,w”
- Run the game
- Assuming you didn’t die, you’ll notice the first watchpoint has been hit and it doesn’t have anything to do with player death. Lets clear that one.
- Type “wpclear 1”
- Start the game again, and play hard until the Mutant Savior dies.
- You’ll notice the second watchpoint is triggered!
We’ve found the memory location for player lives! We can also take note of the instruction pointer address. It’s at 27AC, let’s set a breakpoint here.
Setting breakpoints
- Type “bpset 0x27AC”
- Type “wpclear”
Continue playing. You’ll notice the breakpoint is hit for every player death except the last one. That’s a bummer! Let’s walk up the stack and figure out a better spot. On some CPU types, you can do just that, but with the 6809 that’s powering Robotron you can’t. So we’ll turn the trace file, run the game until we hit our breakpoint, and then close everything. We can step back up from the bottom of the file and see if there are interesting addresses to set breakpoints on.
Trace file
- Type “trace trace.txt”
- Start a game and die
- In the debugger type “traceflush”
- Then type “trace off”
Open the trace.txt file in an editor. Go all the way to the bottom. You’ll see a nice trace with repeated blocks called out. I use these blocks as starting points for new breakpoints. If you scan up the file, you’ll see repeated addresses of DC56. Skip above those, they’re not interesting. We want to find the first branch of code that doesn’t repeat. Just scanning here are the addresses that seem interesting to me:
0xD676, 0xD8BC, 0xD1ED, 0x30FE
Let’s set some breakpoints:
- Type “bpset 0xD676”
- Type “bpset 0xD8BC”
- Type “bpset 0xD1ED”
- Type “bpset 0x30FE”
Start running!
You’ll notice D1ED gets triggered alot, so disable that one with the “bpclear (breakpoint number)” The same thing happens to D8BC and D676. But, 0x30FE seems to work!
Summary
I hope this helps people get used to the MAME debugger. After you have this information, you may want to do something with it. We choose to broadcast game events over UDP. You can see how by looking at our Github repo here.
PRAISE THE MUTANT SAVIOR!
Party House
Party House is a projection mapped dollhouse that was quickly thrown together for the DorkbotPDX Open Mic Surgery event. It was written in a few days using the Cinder library. The source code is available here: PARTY HOUSE REPO.
It was super fun to perform. It wasn’t a complex or hard thing to do, but sitting up on stage pumping my fist and hitting space bar over and over again to the beat was fun. I’d definitely like to do more of this kind of “work”.
I had originally followed this Madmapper tutorial on mapping a building with madmapper and creating a video to go along with it in After Effects. It was a great introduction. I ended up running into problems in my case because the doll house had lots of overhangs and different planes to work with. Maybe if you’re projecting on a huge building, the building dwarfs the projector by enough that you can treat it as one plane. But in this case, I had to create a bunch of planes to make everything line up nicely.
This is also the first time I’ve used After Effects at all. It was nice to just make some videos and them layer them on the fly during my set. I definitely want to spend more time learning After Effects for future projects.
I ended up writing my own software to do the mapping because I’m a hacker and just wanted to. The code isn’t that great, but I do think the EditorViewport and ControlPoint classes are nice enough to re-use in future projects. I also updated the code to use the newest branch of Cinder, so it now supports multiple windows. It was also fun to start using C++11 features.
Church of Robotron
The Church of Robotron is a future looking group that is attempting to save the last human family. We did a large pop-up church installation at Toorcamp 2012. It had the following features:
- During gameplay Jacob’s Ladder and Sparker were running
- Fog machine randomly triggered
- Lasers fired in real life when enforcer shots were fired in game
- Rotating flapper near player hands spun when humans were killed by Robotrons
- Animated gif of your face at time of death in game which was displayed on a leaderboard in the other room.
- Bright LED flash on death, this allowed us to get a decent picture from the webcam on death and added to the players disorientation on death
- Kneeler base which detected players and controlled lights.
- Readerboard which displayed top player and witty statements
- Randomly shuffling sermon videos
- Lit totem pole
- Reading room which contained stickers, chick tract, and a zine.
I hacked MAME to expose debugging events (breakpoints, memory watchpoints) to clients via sockets. I also did some reverse engineering of the ROM to find out game events (deaths, high score, etc). To do this, I built upon the work of the great Sean Riddle. I also used OpenCV to capture the players faces when they died which were posted to the high scores page. We had about 15 people working on various pieces of the project. It was great to see it all come together and it was great to see people’s reaction to it!
Source code is available here. More tech details will be written at some point. I’m planning to write a quick post about mame hacking at some point soon.
BOBBEVY, This is how we Disappear
(Seek 19 minutes in)
“This is how we Disappear” is a 25 minute dance performance created by the BOBBEVY dance company. I used a lot of random technologies: Cinder, Microsoft Kinect, libfreenect, OSC, and Control to create realtime dancer reactive visuals to go along with the performance. We performed it quite a few times and my favorite time was at Hollywood Theatre as part of Experimental Half Hour. It was great to see the graphics projected so huge!
I’ve learned quite a bit about what’s required to do visuals for a performance from this project. It’s definitely influenced everything I’ve done afterwards. I’m hoping to do more of this type of work in the future.
Some post-mortem notes:
Using the Kinect is a performance space is a pretty harrowing experience. If there’s a lot of reflection or IR noise in the room, the Kinect can just die. I think there are some tweaks you can do in libfreenect to allow one to continue to get data, but it’s likely to be too noisy to work. I ended up creating a fallback that allowed me to “draw” the dancers with my figures with a Control sketch. But that method isn’t ideal.
I initially triggered everything with keyboard keys, but it became hard to remember what did what after a while (even for a powah user like myself). Have an iPad user interface was much nicer and allowed the BOBBEVY crew to run the show themselves when they performed in Milwaukee. In theory, this would also let me trigger the cues far from the computer which would give more options for where the computer and Kinect go. In practice, the UDP packet loss when doing Adhoc networking seemed to high to rely on this. It’d be nice to have a TCP transport as an option in the future.
I also added Bonjour discovery to everything, this made it much much easier to get everything configured before a show. I recommend this to people doing multi-machine work.
DorkbotPDX Exquisite Corpse
![]()
I contributed to this project. I can’t reveal details until we reveal the whole project!
(PS: We did complete this project)
The Missing Link
I created the initial firmware for the Missing Link. It’s an OSC receiver that outputs MIDI. The purpose is to hook up OSC clients such as TouchOSC or Control to older synths. The source is available here.
Read below for my post mortem notes.
This was my first “large” microcontroller project. It consisted of the following pieces:
- WIFI module
- MIDI in/out ports
- USB in (used to upgrade firmware, provide power, and did USB midi)
- Was able to route between all of the ports. Wifi->USB Midi or normal MIDI and all permutations.
Software wise we used the following:
- Arduino libraries (ended up stripping this down alot to fit the ROM space we had)
- Two libraries by my friend Alex: a MIDI library focused on microprocessors, and a bootloader that uses sysex as a data transport.
- uIP a tiny TCP/IP stack for microcontrollers, this was fun to hack on!
- Protothreads, was a great way to organize async code. It abuses C via Duff’s device, and I LOVE IT.
By far, the hardest pieces to get working was communication channels. First, getting I2C working between the PIC and the AVR we used was hard to get reliable. It was hard to even get working initially! I learned the hard way that people interpret I2C address differently. It’s best to spam them all.
Secondly, getting the USB midi code working well was a challenge as well. But it was fun to dive in and learn about USB.
Overall, I learned quite a bit from this project. If I were to do it again, I’d probably not use the Arduino prototype code we started with and go with straight C. The current codebase is a combination of different approaches. But as with a lot of projects, we were working under time constraints.
Processing Class

I gave a class on using Processing to create simple graphics. Also quickly “covered” using the OpenCV addon to detect faces. Notes, slides, etc are available here.
It was the first time I’ve taught a class in quite a while. I got a fairly positive response (from my friends, so they have to be nice to me!). I think I did a good job setting up mini-goals that took 20-30 minutes to accomplish. The idea was to give everyone little victories quickly so they’d be motivated to stick around and conquer more.
Morse Code Lights
One of my first electronics projects: Morse code xmas lights. Also here.
Bits and pieces
I actually haven’t done too much rendering work in the last six to eight months. I’ve been doing a lot of game prototyping. Two prototypes have been put to the side for now and I’m working on a third with a couple of folks. I’m just going to dump out some random snippets I’ve learned through that process.
- Sound is a very important cue for debugging! While working on a kart racing prototype I was able to feel the kart slide much easier when hearing it then when looking at the visual debugging cues we had set up. Another spot where sound made it easier to debug behavior is state changes. If you’ve got some bug where state changes happen really fast, they may not make the player respond visually. But if it’s triggering snippets of sound on state change you’ll know something wacky is going on.
- Update order matters. This is something I knew about before, but it doesn’t hurt to repeat it. In this situation I had a bunch of force constraints that where always updated from one side to the next, eventually the system developed a “lean” and I couldn’t figure out why for a while. I changed it so that it updated one corner, then the opposite corner and so on and the lean disappeared.
- More to come once I remember them. ;)
- I’m also thinking about submitting a talk for GDC10. It should be a fun topic to flesh out, I hope it all works out.
I finally broke a million in Robotron!

Torque 3D Lighting System Video
Just a quick link post today. Here’s a video of the lighting system I’ve worked on with Pat Wilson and Tom Spilman. I’m mostly responsible for the dark pixels in the video. ;)
Also, I got a new personal best score at Robotron today: 624k. I’m slowly inching up to a million.
Probabalistic Shadow Map Technique Comparisions
This is a quick slideshow of screenshots and notes about various shadow map techniques. I hope to continue adding to this in the future. The notes are pretty terse and probably not useful unless you read the source papers. ;)
Math Debugging
I’ve gotten a late start on this rendering thing. One of the pieces I’ve been struggling with is math. I’ve improved quite a bit over the past year and I’m actively educating myself to catch up. Recently, a friend of mine asked me for some help with a matrix problem. Here’s what I told him to help him debug (I wish I could go back in time and tell myself this!):
- If you’ve got a series of matrix multiplications, make all of the terms identity. Then change each to be a real value one by one. For example: Let’s say you’re rendering an object with a lot of sub-meshes or sub-objects. You’d set the subobject’s transforms to identity and the main object’s transform to identity. This will make everything render on top of each other. From here, you concentrate on getting the sub-objects transforms correct, then finally work on the main object’s transform.
- Try creating situations where the results of an equation would be identity. For example: When using a shadow map, you need a matrix which transforms a point from camera space to light space. If the camera and the light have the same transform (and FOV, view distance, etc) then this matrix will be identity. If you run it through your code and it’s not, you know you’ve got some problems to solve!
- Pay close attention to what space your source data is in. If you feed object space points to a function that expects world space points, it’s not going to work!
- Check out Octave, it’s basically a free version of MATLAB. You can use this to play with matrices and vectors, probably much quicker than you can do in-engine.
These are just general divide and conquer debugging tips applied to math. But for a person new to large amounts of math in programming, it can be non-obvious to think about applying those debugging techniques to math problems. Does anyone out there have their own favorite math debugging tips?
Quick PIX trick
Let’s say you’ve got a render state problem. If object A is on the screen at the same time object B is on the screen, object A gets screwed up. Here’s a quick way of using PIX to track it down:
- Take a snapshot of the frame that works and a snapshot of the frame that fails.
- In PIX, find the draw call that draws object A in the frame that works
- Go to the device state tab
- Copy and paste each page of state into a text file
- Repeat for the frame that fails, save this to a separate text file.
- Diff the text files with your favorite diff tool!
This is much easier than trying to diff the states manually within PIX itself. PIX should have a draw call diff as part of its standard functionalty!
Why are these new shadow map techniques filterable!?
I’ve only been doing graphics stuff seriously for about a year. One of the first things I tackled was shadow mapping. I got a simple shadow map implementation going and then implemented Variance Shadow Maps. It’s based on statistics and the big deal is that you can filter your shadow map and get filtered shadows as a result. At the time, I didn’t understand why that was true. I had assumed it was a special property of the Chebychev Inequality. I just implemented it and went on. Yesterday, I quickly tested Exponential Shadow Maps. While looking at it, it finally struck me why it was filterable:
These new shadow map techniques are smooth functions based on the occluder and receiver distances to the light!

Above is my Microsoft Paint created graphs (grabbed this style of graphing from Pat Wilson heh). On the left is ESM, you can see that it smoothly drops from 1 (fully lit) to 0 (fully shadowed). So if you massage your shadowmap and you get values on the x-axis (which is occluder - receiver), you’ll see that there will be a border of grey values (basically from -5 to 0 in the graph above, btw this is not what e^(c*o-r) actually looks like, heh). On the right, standard shadow mapping is just a step function. If you move this a little bit below zero, you’re immediately shadowed completely.
This is a also a reason why you don’t need to worry about shadow map bias as much with these new techniques. Because the shadow function isn’t all or nothing, if occluder - receiver is -.9999, you’re going to look basically lit. But in standard shadow mapping, -.9999 is fully shadowed, and you’ll get shadow acne.
So you could draw any random function as a 1d texture and use that for shadow mapping! These other techniques are just ways of creating that function in a way that is fast and makes sense visually.
The silly thing is that I knew why standard shadow maps were not filterable from the get-go, I just didn’t “invert” my thinking to figure out why these new methods were filterable.
Random notes on Quadric Error Metrics
Mesh decimation is the process of simplifying a mesh. Most of the time you do this to improve performance. A popular method of mesh decimation is called the edge collapse. You move a vertex from one side of an edge in a mesh to the other. Then you delete any degenerate triangles. One of the first things you need to do is decide which edge is the best to collapse! Computing a Quadric Error Metric) (QEM) for a vertex is a method of determining the cost of an edge collapse.
The basic idea is that the QEM gives you the sum of the squared distance of a point to a set of planes. Then for each point in your mesh, you build a set of planes from the triangles it belongs to and you can use the QEM to compute the cost for moving a vertex from its starting position to a new position. It has some neat properties. If you add two quadrics together, it’ll return the same results as if you built a quadric with all of their source planes from scratch. This is convenient during mesh decimation because you can combine quadrics after performing an edge collapse.
After implementing the QEM code, I noticed some things:
-
If you calculate the error for a vertex without moving it, it should be zero. This is one way to validate your implementation of QEM.
-
If you look at the formulas given in section 5.1 of (http://graphics.cs.uiuc.edu/~garland/papers/quadric2.pdf). You’ll see that it calculates two edge vectors to define a plane. The vectors are defined (in pseudo code) as: e1 = q-pe1.normalize()side2 = r - p
side2.normalize() // <- This is not in the original paper
e2 = side2 - (e1 dot (side2)) * e1
e2.normalize()It turns out that it’s better to normalize side2 before calculating e2. You can confirm this by doing a dot product between e1 and e2, it should be very close to zero. For larger triangles, or nearly degenerate triangles, I ended up with e1 & e2 not being perpendicular at all. This just causes havok later on, producing large negative values for the distance calculation, which should be impossible! ;)
-
The verts that you choose for p,q,r matter. If you play with the ordering, you can see that the error will change a bit. I tried to make sure that (q-r) dot (r - p) was as close to zero (as close to perpendicular) as possible. So I swap p,q,r until I find the combination that’s closest to zero.
-
For some inputs, it works much better with doubles vs. floats. But even with doubles, you must make sure that the double precision rounding is enabled. DirectX will often change this on you unless you tell it not too! If I had remembered this sooner (this has caused other problems for coworkers), I probably would not have figured out 1 & 2 above! ;)
I’m working on improving the rest of the decimation system. Some of that work will involve not feeding the QEM bad triangles that are nearly degenerate which will make the changes above less important. But now that I’ve explored and fixed some of these issues I’m confident that this brick in the decimation system is solid!
A PIX debugging session
Here’s an article I’ve been meaning to write for a little while. It’s about PIX, the DirectX utility that ships with the DirectX SDK. It’s a great utility for tracking down rendering issues. The point of this article isn’t really to explain it in great detail, because it’s easy to use. It’s mostly to expose people to the tool and encourage you to check it out! This is a debugging session I did after tracking down a crash bug in dynamic cubemaps in the upcoming TGEA release. The crash bug was pretty easy to find. But when I fixed it, I got this result:

The “spider ball” in this image should be reflecting the tower it is next to, what gives? Let’s use PIX to figure it out. First, to launch PIX, find it under DirectX Utilities under the DX SDK folder. You’ll get a blank screen. Next, select File->New Experiment. Then for “Program Path”, enter the path to your executable. Then, select the “A single-frame capture to Direct3D whenever F12 is pressed.” radio button. Finally, hit the “Start Experiment”. This will launch the app. The next step is to get your app to render your bug. In this example, I moved the camera so I was looking at the spider ball again and hit the F12 key. The game will pause while PIX records all of the DirectX API calls and state into a log file. Then quit. You’ll end up with a screen like this:

The treeview in the lower left pane is a list of all DirectX calls made during the frame that was recorded. If you click on the render tab in the right pane PIX will show you the scene up to the API call selected in the left pane. You can learn a lot about how an app renders by just hitting the “D down” button and watching the scene draw step by step in the render pane.

It’s cool to have all of this information at our fingertips, but it’d be cooler if we could filter it down to what we’re interested in. By right-clicking on a pixel in the scene and selecting “Debug This Pixel” we can do just that.
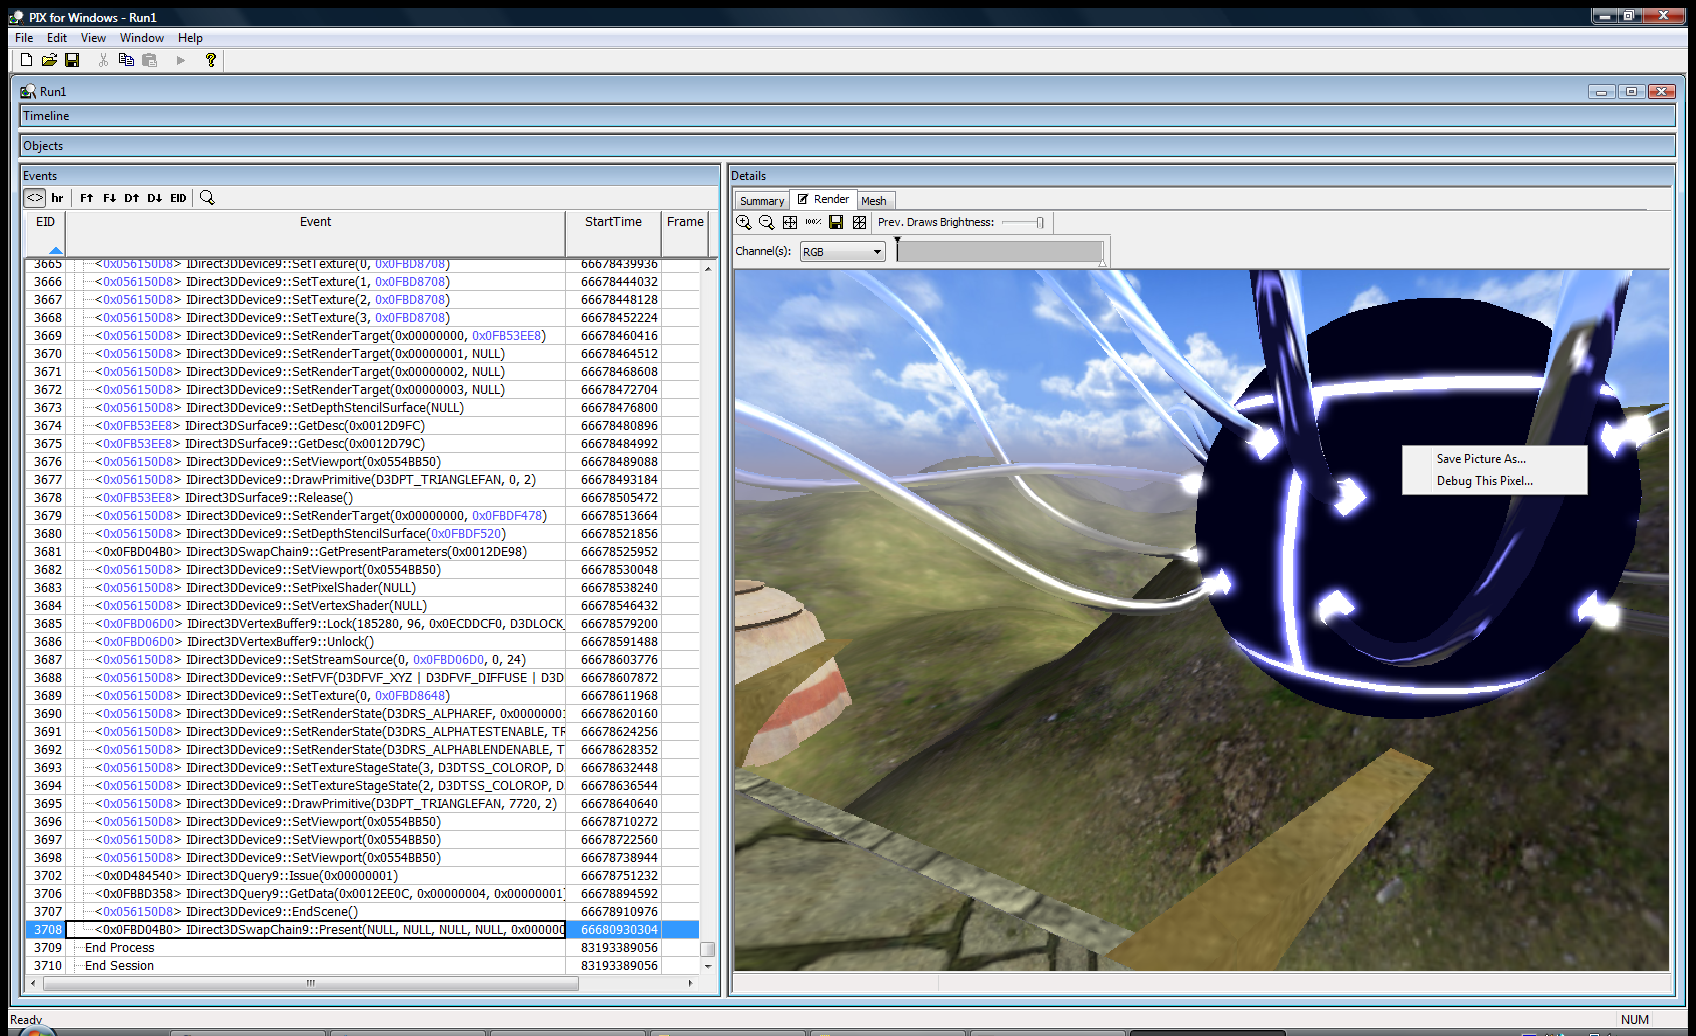
This will replace the render view with a list of all of the API calls that changed the color of that pixel. It’s a life story of that pixel for that frame. You can click on each of the links displayed to move the current selection in the treeview in the left hand pane to that API call.

In this next image, I just picked the first pixel that was black, which should get me to the API call I feel is generating the wrong image. It’s event 2893.
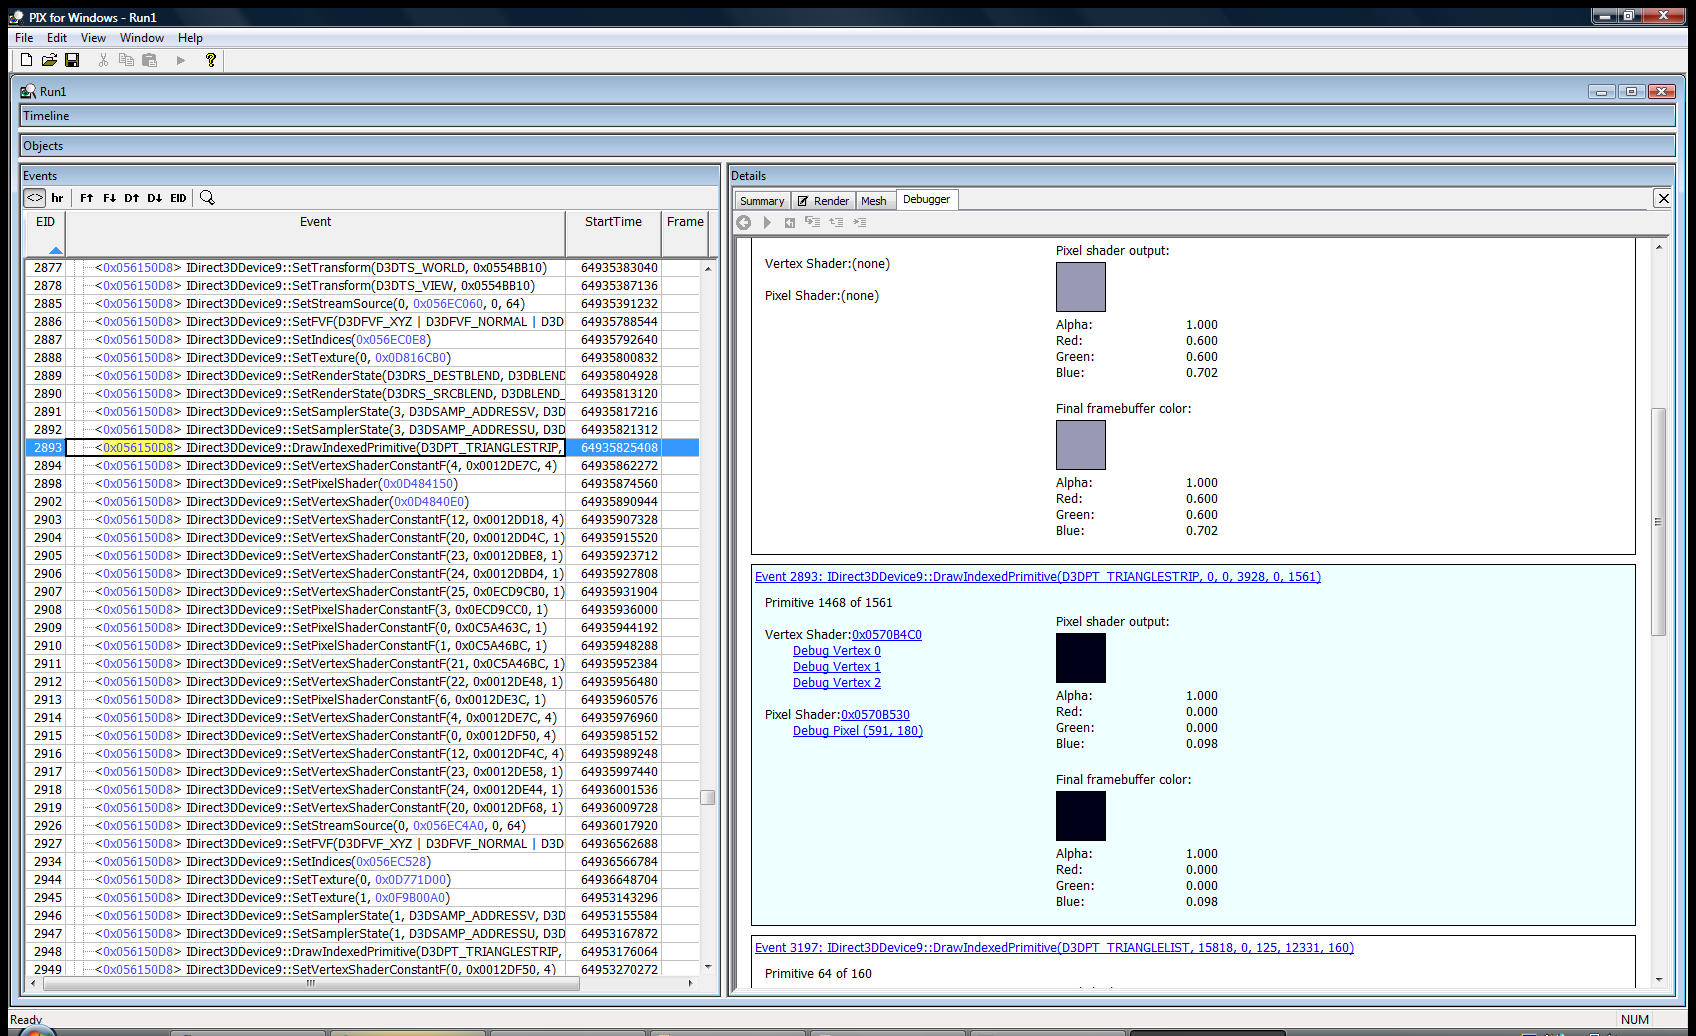
Now we can examine the state of D3D at the time of this call. This is awesome stuff! Rendering with DirectX (and OpenGL) basically involves setting up a large state machine. The types of states are rendering states, textures, texture sampling states, shaders, shader constants, and the list goes on. If any one of these states is incorrect, you’ll get rendering bugs. They can be hard to track down without a tool which allows one to examine the state of D3D. Often we have to do ad-hoc state checks by dumping textures to disk or querying the device and logging the state info out to a file. PIX provides the ability to check state without modifying your code. Getting back to my dynamic cubemap problem, the first question we must answer is: Is the dynamic cubemaptexture being rendered correctly? If it is being generated correctly, are we actually using it during the draw call? Let’s find out! Double click on the blue hexadecimal address to the left of the API call in the treeview in the left hand pane. In this example, it’s 0x056150D8. This will change the right hand pane to a view of the device. We can see a lot of state here. I want to look at the textures, so I choose “Pixel State” from the tabs and scroll down to the “Sampler” section. This section allows one to look at all of the current textures that are active during a draw call. Many bugs are just due to the wrong texture being bound, or no texture is bound at all!
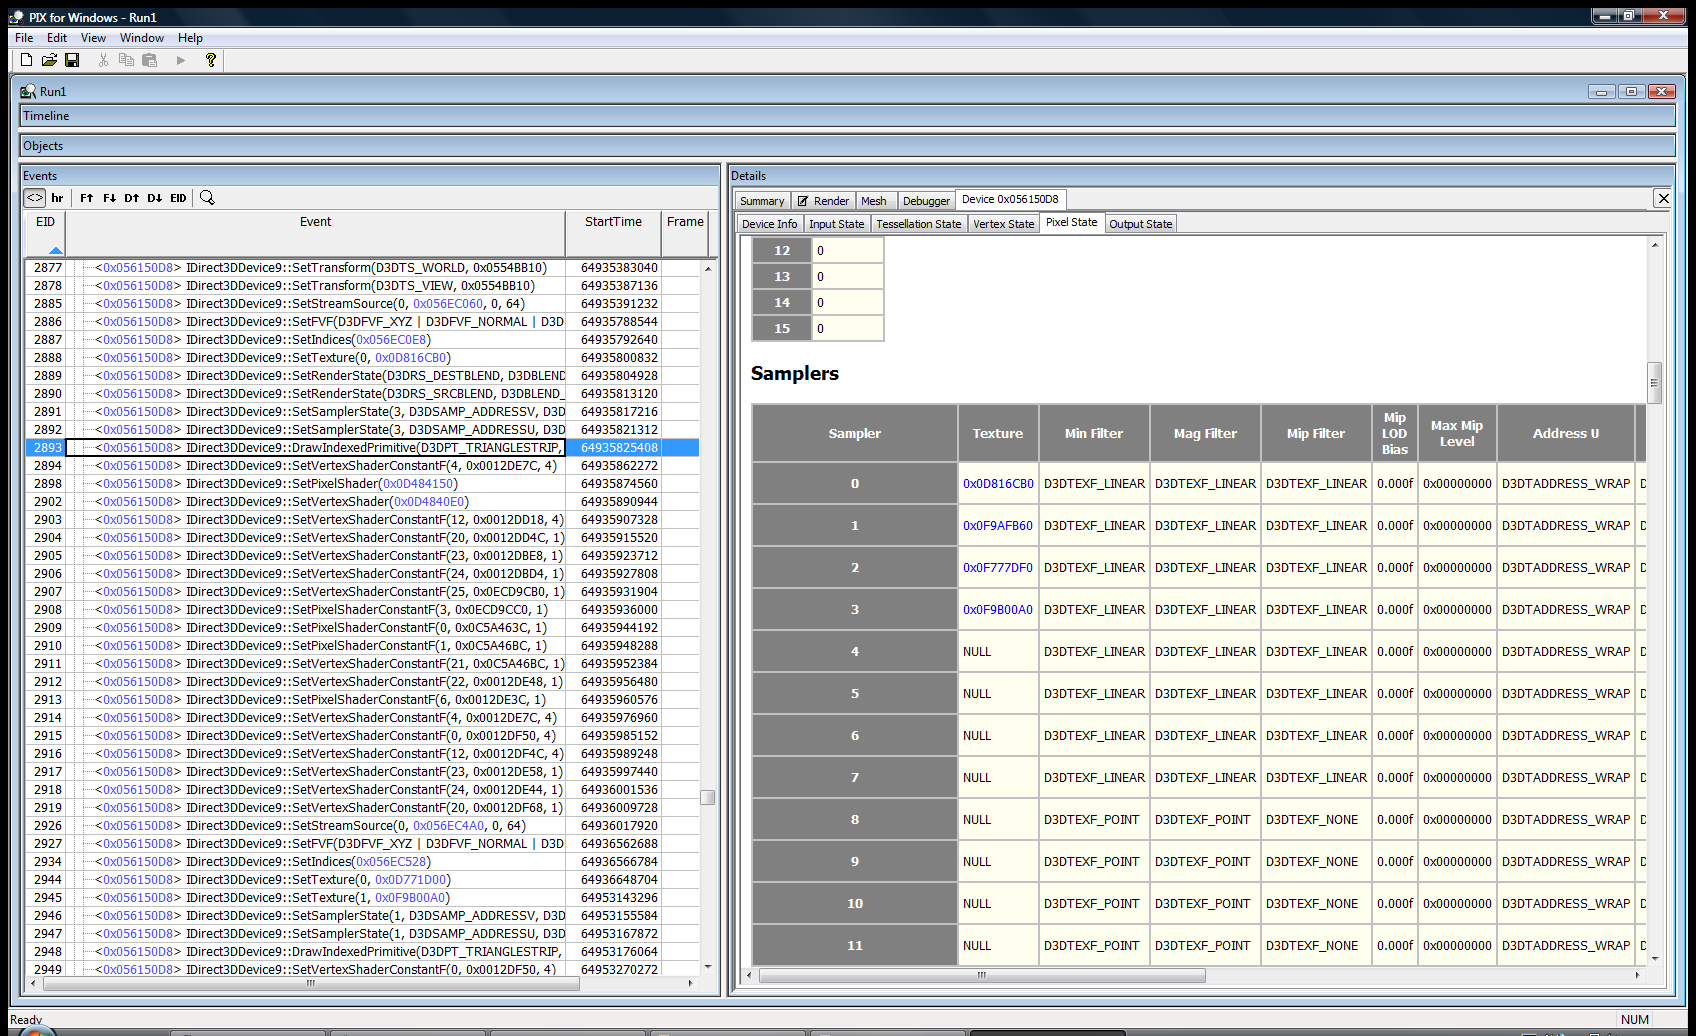
To actually look at the texture, just double click on the blue hexadecimal address in the “texture” column. In the next picture, you can see the cubemap texture has data in it! This is good news, that means I can ignore all of the code that deals with generating the cubemap.

Next, I wanted to look at the pixel shader code that is used. Mostly because I forgot how the cubemap was working at the time. I wanted to see what other dependencies it might have: other textures, shader constants, etc. To do this, go back to the debugger frame that showed the history of the pixel and click on “Debug pixel (xx,xx)”. This will bring up the pixel shader that was used.

Looking at the shader, it only samples the cubemap and doesn’t rely on any shader constants. It’s time to look at the vertex shader to see what it passes to the pixel shader. To do this, just select “Debug Vertex X” in the history view.

Looking at this dump really fast, I could see that it needed to have these vertex shader constants: $modelview @ position 0, $cubeTrans @ position 16, and $cubeEyePos @ position 19. Let’s check the vertex shader constants and see if the data is good. To do this, select “Vertex State” from the tabs and scroll down to the vertex shader constants.
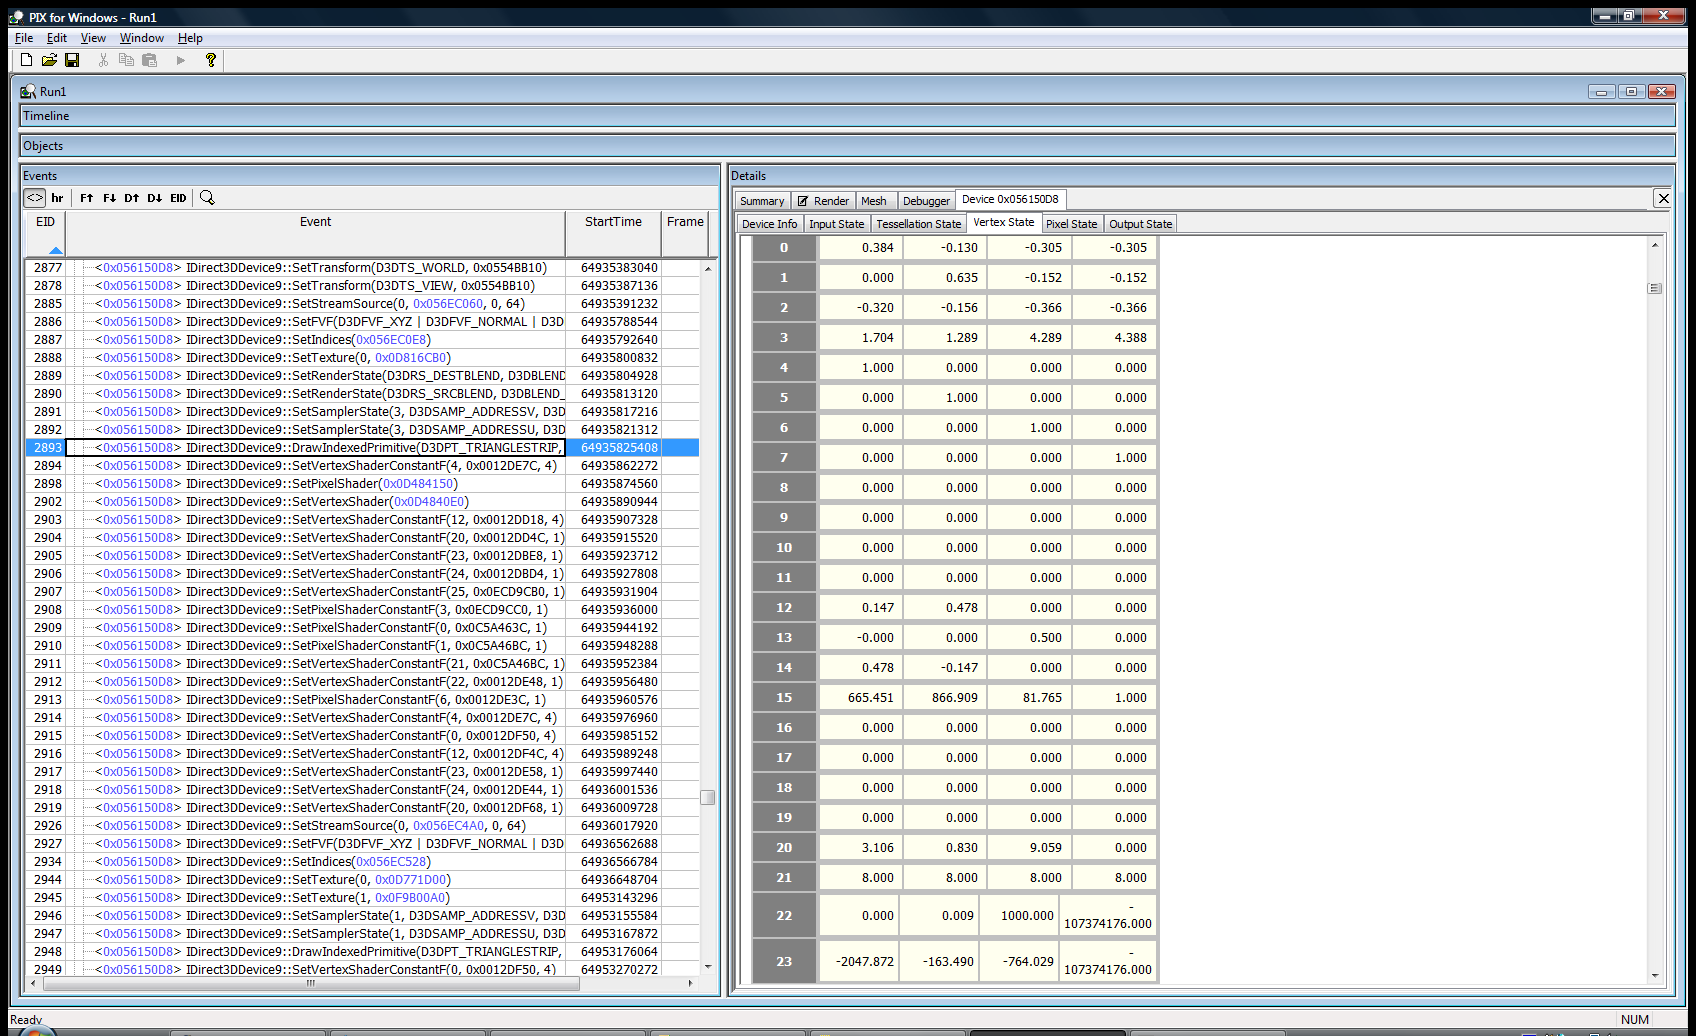
Oh crap! Look at positions 16-19, it’s full of zeros. So the cubemap transform isn’t getting set! I quickly searched the code to see what sets them up and found out that they’ll only be set if the material has “dynamicCubemap” set to true! D’oh! I fixed the material and got the following screen:

That was literally my debugging session, it took about 5 minutes. It could have taken a lot longer if I didn’t have the right tool. Hopefully, this was a good introduction to PIX. There are other uses for it: performance monitoring, resource usage, but this is what I use it for the most. I hope this article makes you reach for PIX the next time you have a rendering bug.
Back to basics: Projection transform
While working on Parallel Split Shadow Maps something that had been tripping me up was calculating the bounding box of a frustum in a light’s clipspace. I need this bounding box in order to scale the projection matrix to look at the piece of the scene that I’m interested in. I’ve noticed that other people have struggled with this problem as well, so I thought I’d post what I found.
My problem: So the problem I’m solving is this: Given a frustum in world space, find the bounding box of that frustum in the light’s clip space. My attack was this:
1. Translate each point of the frustum into light space. 2. Using the light’s projection matrix, translate this point into clipspace. 3. Project the point by dividing by the points .w coordinate. 4. Finally, check against the current min/max points (standard bounding box construction).
Which are the correct general steps. The problem is when a point that was one of the bounding boxes min/max points went behind the light, it wasn’t being counted correctly anymore? What gives?
Quick recap of clipspace/projection:
The clip matrix for D3D looks like this:
| xZoom 0 0 0 | | 0 yZoom 0 0 | | 0 0 (farPlane + nearPlane)/(farPlane - nearPlane) 1 | | 0 0 (nearPlane * farPlane)/(nearPlane - farPlane) 0 |
This basically allows for field of view (xZoom/yZoom) and near/far plane clipping. The goal of the matrix above is to scale x,y,z& w coordinates of a point to the values needed to project it to 2d and to provide clipping information. If 0 <= z <= w, then the point is within the near and far planes. This also works for the x & y coordinates by comparing against -w and w.
For my problem, we can simpify this matrix down to this:
| 1 0 0 0 | | 0 1 0 0 | | 0 0 1 1 | | 0 0 0 0 |
Which turns projection into just dividing x & y by z. This is the way most of us did 3d when we were little kids.
The issue was my mental model of projection was wrong. I basically thought of it as a flattening operation. That is true when the points are all in front of the camera, but when points are behind the camera the x & y coordinates will actually get mirrored due to the z coordinate being negative! So if z = -1 then it’s going to flip x & y, duh!
In my case, I needed to use the absolute value of the w to get the number I needed. I doubt this is an issue that will come up often for people, but I just thought I’d share what I learned by repeating smashing my head against this problem. ;)
Notes: Here’s the slide-deck that triggered this in my head: http://www.terathon.com/gdc07_lengyel.ppt
Slide 7 has a great graphic, basically, the red area is the flipped coordinates.
Example: In front of the camera: untranslated: -10.000000 100.000000 0.000000 1.000000 clipspace: -10.000000 -0.000006 99.909988 100.000000 normalized device coords: -0.100000 -0.000000 0.999100
Behind the camera: untranslated: -10.000000 -100.000000 0.000000 1.000000 clipspace: -10.000000 0.000006 -100.110016 -100.000000 normalized device coords: 0.100000 -0.000000 1.001100
You can see that behind the camera the x&y coordinates are flipped!
Here’s the code for the above little experiment:
void testProj(Point4F testPt) { MatrixF proj(GFX->getProjectionMatrix()); Con::printf(“untranslated: %f %f %f %f”, testPt.x, testPt.y, testPt.z, testPt.w); proj.mul(testPt); Con::printf(“clipspace: %f %f %f %f”, testPt.x, testPt.y, testPt.z, testPt.w); testPt.x /= testPt.w; testPt.y /= testPt.w; testPt.z /= testPt.w; Con::printf(“normalized device coords: %f %f %f”, testPt.x, testPt.y, testPt.z); }
Point4F inFrontOfCamera(-10.0f, 100.0f, 0.0f, 1.0f); Point4F behindOfCamera(-10.0f, -100.0f, 0.0f, 1.0f); Con::printf(“infront”); testProj(inFrontOfCamera); Con::printf(“behind”); testProj(behindOfCamera);
XCode for Visual Studio Users
Here’s another older article that I reckon I should just get out of the queue. As a pretty hardcore Visual Studio user, my initial experience with XCode was awful. After using it for a while, XCode isn’t so bad. I still prefer VS as it’s more mature, but here are things that I had problems with and fixed:
Problem: It opened more windows than I can keep track of. Answer: Turn on the three pane mode. **Problem:**I was unable to figure out the auto-complete keyboard code! I asked two or three different Mac people, and no-one understood the circle icon which was supposed to be the keyboard shortcut. **Answer:**It’s the Escape key! So much for being intuitive!
Random neat things about XCode!
- Ctrl-Apple up will toggle between the header and source file. This is something I’ve always wanted in VS (I know there are macros to do it). Delphi IDE’s was really good about jumping between the implementation and interface of a class.
Not so neat things:
- I haven’t used the debugger to much, but it doesn’t seem to let you right-click on a file global and add a watch. You must go through the global variable tree. It always loses these watches between invocations which is annoying.
How to Navigate Large Codebases Quickly
To break up all of the high score posts, I’m just going to publish this old thing I never finished. I think it’s a good starting point for a good article or something. Every developer gets dumped into a large codebase they don’t know anything about at one point or another in their life. Torque has 1.3 million lines of code spread out over 2800 files, not including TorqueScript. The Windows XP tree is estimated to have 40 million lines of code.
How are you supposed to comprehend something this large?
The answer is simple. You don’t. It’s likely you’ll never know exactly how the whole system works. Even the people that wrote it will not know over time. The best you can do is create a model about how each of the pieces of the system work and correct this model as you debug and learn more about it. I asked a guy during an interview how he explores a new body of code. His response was that he liked to look at every file and function and see how it all works. Can you imagine trying to do that to Windows XP? You’d never have time to write new code!
How does one build a model of an application? I usually start by simply using it for a while. The goal is to grasp what the major bodies of functionality are. The next step is to pick a small modification and figure out how to implement it. Then you start using the tools below to figure out how to do it. The reason for this is to create a filter in which you can start examining the source code. Without it, you’re just staring at a huge monster with no weapons to attack it!
Grep and Find in Files. This is probably the best tool for doing this kind of exploring. Most of the other tools are just refinements of this. Just start searching for keywords that are similar to your modification. If you’re working on a GUI library and your modification is to create a “SuperButton”. Just do a grep for “Button” through the source tree. You’re likely to get waaay too many hits for a simple query like that. This is where you turn to regular expressions. Change your search to “class.*Button” to find out where the Button (or descendant class) are implemented, assuming C++ as the target language.
Go to definition. This is in Visual Studio and Eclipse. You can right click on any symbol and select “Go to definition”. This will take you where the class or function is defined. A shortcut for above. Get callers (Eclipse) , or Find All References (Visual Studio) This lets you see what uses a particular object/method. Useful to figure out code flow/structure and to figure out how large of an effort changing that object/method will be. Breakthings! I love just commenting out large bodies of code and watching the effects on the system. This is a great way to validate assumptions about what a body of code does. I just recently confirmed I was looking at the wrong piece of code by commenting it out and not seeing the effect I expected. Remember Project forces. The reasons behind why a particular piece of code was written are rarely purely techinical. Some pieces of the system may have been written under different time constraints, different goals that do not apply anymore, or just different coding philosophies at the time. Keep this in mind while mining through a new codebase, it will help understanding of the code (and also of the team that wrote it).
more highscores, how borring
A good day so far: Gave my two weeks of notice today. It was hard to do because this is a cool place to work. But I’ll be making games soon, so that’s even cooler! Also, a new Robotron highscore today: 413850. I talked to a guy at PAGDIG (http://www.pagdig.org) who met Eugene Jarvis the creator of Robotron. Apparently, he asks if you break a million. So that’s definitely my new goal. More content soon, I hope! ;)

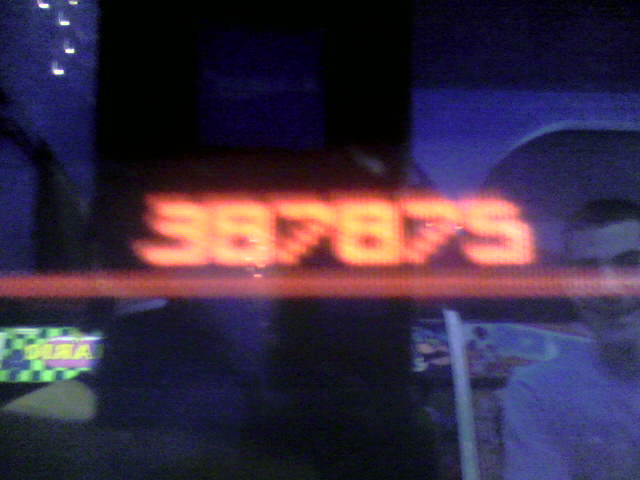
New (old) highscores!
I got these a while ago and have been too lazy to post. Q*Bert: 137320, Robotron: 387875
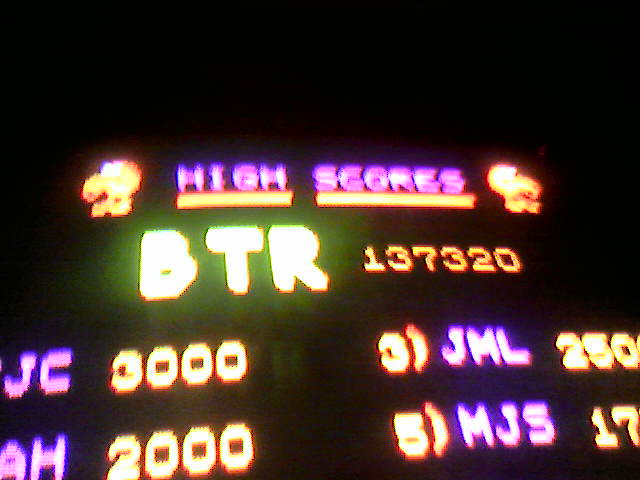
Still need to work on my homebrew Wii robotron clone. I have a “player” working. Need to get hit detection and enemies on the screen next.
Homebrew Weekend
I’ve got free time again and I want to try out some homebrew console development. I’ve got a Wii, so I’m looking at GameCube homebrew for now. The steps as I see them are:
- Get someone elses homebrew working on my system.
- Get a dev environment setup, compile someone elses stuff and run it.
- Write some silly stuff of my own (I’m thinking Robotron ripoff)
- Profit!
I’ve got step 1 done. I bought a Datel SD Media launcher which allows one to load .dol and .bin files off of a SD card. I’m curious how the Datel CD is bootable by the Wii. How’d they pull that off? I also got some cheapo Gamecube controllers and downloaded some ROM’s from here: http://www.dcemu.co.uk/vbulletin/showthread.php?t=48442
So now I’m onto steps 2 & 3, this is my launchpad for that: http://www.tehskeen.com/forums/showthread.php?t=2968
Update: Neat, that didn’t take very long to do. I was expecting quite a fight to get a dev environment running for some reason. Onto step 3!
New Q*Bert high score!
118420!

Not Breathing -- The Black Old Pueblo
I got this new disc from Not BreathingThis disc is awesome. The great tracks on the disc are Dead Voices on Acetone and the crazy one about treating your mom right (What’cha Mom Wearing).
I also get a random bonus prize with my disc:
 It’s some random ass circuit board that looks like it used to plug into something judging by the traces at the bottom. This is why it’s best to order direct from the creator. ;)
Effective searches
Being smart about searches is key to exploring large codebases. You have many approaches to take to get better searches:
One must exploit language syntax to get search results that don’t suck. Some examples for C++:
- To find out where a method is implemented, prepend :: to the method name. An example would be “::OpenPort” to find all implementations of the OpenPort method. The great thing about this trick is that it filters out the definition in the .h file, and it filters out users of the method (except for static callers).
- To find out where a method is called from, prepend the -> operator to your search “->OpenPort” will hit most of your callers.
One must also exploit code base conventions.
- In the Torque Game Engine there’s a scripting language. The engine exports functions to the language with a macro called “ConsoleFunction” or “ConsoleMethod”. So if I want to find out all of the console functions & methods available to me. I can use the following regular expression: “Console.*(” and get my list.
Some IDE’s (Visual Studio, Eclipse) will give you this information without these searches. Which is nice to use when they work and when it’s available. The great thing about these text tricks are they work everywhere that “Find-in-files”/grep is implemented.
You can get away without such tricks. But you’ll spend a lot more time parsing your search results for the information you really need. I’d rather spend that extra time slacking. ;) More tricks to come as I remember/use them!
Robotron
 Got my best score in Robotron 2084 recently: 136600. I’m not a super master by any means, but that’s damn good for me. Here’s a pic from Ground Kontrol. Gotta take the pic because the machines are reset nightly. It’d be cool to start a Flickr pool, or random high score site for Ground Kontrol.
From Windows to Mac
I’m not a convert, but I’ve had to jump over to port a project I’ve been working on. Here are some of my thoughts about it:
The Good
- Spotlight is great. I don’t use Finder to launch anything. I never understood why navigating the Start Menu, or using Finder was a good way to launch apps. I usually know what I want to launch, I don’t always know where it lives in the launch structure. For Windows I had written a tool called kbLaunch which does a similiar thing.
- Bundles are awesome. It’s nice to return to such a simple concept of an application living within a single directory. It definitely beats throwing files all over your system.
- Having Unix command-line utilities again is really fun. I stopped running FreeBSD/Linux at home a few years ago after fighting some program to watch a DVD. So it’s been a while since I’ve had these nice tools. I might just install Cygwin on my Windows box now.
- Apple Mail’s search is waaay faster than Outlook
- Not a user thing, but Apple has released 4 revisions of OSX since 2001. In that same timeframe, Microsoft has only released Windows XP and 2003 Server.
- Time Machine looks really cool. I’m a huge fan of revision tracking and having it integrated into the file system with a slick UI on top is really promising.
The Bad
- Keyboard support isn’t as good as Windows. I’m a big fan of using the keyboard to select menu items. I can smash Alt-F F 3 and open a recent file in Visual Studio really really fast. But on the Mac, you can’t seem to open a specific menu with the keyboard. I know you can hit Command- something to get to the Apple menu and navigate over to the other menu items. But that’s really slow and frustrating.
- Window overload. The Mac seems to be a bit too eager to create lots of Windows to keep track of. Before I found the 3 pane option of XCode, I could open 30-40 windows while editing some source code. Trying to wade through all of that was really hard. Apple seems to be trying to solve this with Expose’ and the upcomming Spaces (which seem to be just virtual desktops). I really like the tab approach that most Windows application have adopted and I feel it helps keep the perceptual hit of the UI lower. Although, ideally I think I’d like to switch to any active window with a Spotlight-like interface. Hrmm, maybe I’ll go hack that into kbLaunch!
- Network shares. I don’t think I “get” how it works on the Mac yet. I can navigate to them fine. But they will disappear on me for some reason. Then I have to renavigate to them again. Also, I can’t seem to rename a share to something that is easy for me to remember. If 5 people share their drive as “Macintosh HD” I get 5 mounted disks named “Macintosh HD” that I can’t discern which is which.
- Safari is brutal. Apple should just push Firefox as their browser and maybe have an OSX goodie enabled build of it.
- This is more Googles fault. But if I search for an Apple API call, the first hit is usually a “page not found, redirecting” message from Apple instead of just going to the right place. If I search for a Windows API, I normally get the MSDN page first up.
Stuff to explore
- Automator. I haven’t spent anytime with it yet. It seems like a nice way to glue things together.
The Summary
After actually using the Mac for a while, I like it. Having a nice looking Unix box is a good time. As I said above I’m not a convert. But it is a pleasant environment to work in. For day to day things, I’m just using Firefox and Emacs on both platforms, so it’s not too different. Windows and Mac are basically two flavors of kool-ade, but they’re both just a lot of sugar.
Microsoft Application Updater Block
Microsoft Application Updater Block is supposed to be an example of “best patterns and practices”. It is a decent amount of good code that can be used to build an automated updating solution for your software.
It’s got a lot of great features: compression, only downloading the files that have changed, and hash checking to ensure you’re getting the right file. It’s got unit tests for everything.
The problem with it is, if you try to use them all together it fails horribly. Out of the box if you try to use compression you can’t use the hashes to conditionally download. If you try to use all of these features together you need to store the following info per file:
- Filename
- Compressed hash
- Uncompressed hash
Then you need to modify the code to check the uncompressed hash for the conditional download and check the compressed hash to verify the file you got is correct. Finally, you run it through the uncompressor component to get your uncompressed version. Another annoying bug with the hash checking feature is that it does not support salted hashes. But the tool you use to generate the hash has the salted hash enabled by default.
Overall, it’s a good package but needed some tweaking for real use. I think .NET 2.0 is suppossed to have a new mechanism for updates that I hope is more mature.
random dumb stuff
This is yet another developer blog. Topics will be about debugging, coding, and whatever I’m playing with at the time. I’m putting this together as an exercise to better my writing skills. Maybe I’ll even write something interesting!