Mesh decimation is the process of simplifying a mesh. Most of the time you do this to improve performance. A popular method of mesh decimation is called the edge collapse. You move a vertex from one side of an edge in a mesh to the other. Then you delete any degenerate triangles. One of the first things you need to do is decide which edge is the best to collapse! Computing a Quadric Error Metric) (QEM) for a vertex is a method of determining the cost of an edge collapse.
The basic idea is that the QEM gives you the sum of the squared distance of a point to a set of planes. Then for each point in your mesh, you build a set of planes from the triangles it belongs to and you can use the QEM to compute the cost for moving a vertex from its starting position to a new position. It has some neat properties. If you add two quadrics together, it’ll return the same results as if you built a quadric with all of their source planes from scratch. This is convenient during mesh decimation because you can combine quadrics after performing an edge collapse.
After implementing the QEM code, I noticed some things:
-
If you calculate the error for a vertex without moving it, it should be zero. This is one way to validate your implementation of QEM.
-
If you look at the formulas given in section 5.1 of (http://graphics.cs.uiuc.edu/~garland/papers/quadric2.pdf). You’ll see that it calculates two edge vectors to define a plane. The vectors are defined (in pseudo code) as:
e1 = q-pe1.normalize()side2 = r - p
side2.normalize() // <- This is not in the original paper
e2 = side2 - (e1 dot (side2)) * e1
e2.normalize()It turns out that it’s better to normalize side2 before calculating e2. You can confirm this by doing a dot product between e1 and e2, it should be very close to zero. For larger triangles, or nearly degenerate triangles, I ended up with e1 & e2 not being perpendicular at all. This just causes havok later on, producing large negative values for the distance calculation, which should be impossible! ;)
-
The verts that you choose for p,q,r matter. If you play with the ordering, you can see that the error will change a bit. I tried to make sure that (q-r) dot (r - p) was as close to zero (as close to perpendicular) as possible. So I swap p,q,r until I find the combination that’s closest to zero.
-
For some inputs, it works much better with doubles vs. floats. But even with doubles, you must make sure that the double precision rounding is enabled. DirectX will often change this on you unless you tell it not too! If I had remembered this sooner (this has caused other problems for coworkers), I probably would not have figured out 1 & 2 above! ;)
I’m working on improving the rest of the decimation system. Some of that work will involve not feeding the QEM bad triangles that are nearly degenerate which will make the changes above less important. But now that I’ve explored and fixed some of these issues I’m confident that this brick in the decimation system is solid!
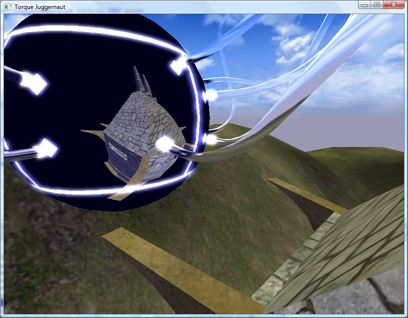
Here’s an article I’ve been meaning to write for a little while. It’s about PIX, the DirectX utility that ships with the DirectX SDK. It’s a great utility for tracking down rendering issues. The point of this article isn’t really to explain it in great detail, because it’s easy to use. It’s mostly to expose people to the tool and encourage you to check it out! This is a debugging session I did after tracking down a crash bug in dynamic cubemaps in the upcoming TGEA release. The crash bug was pretty easy to find. But when I fixed it, I got this result:
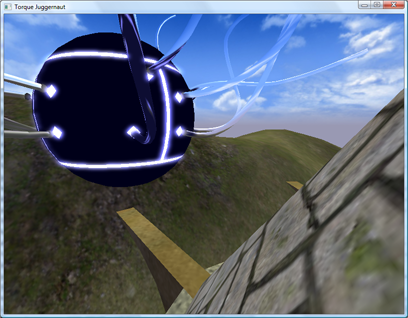
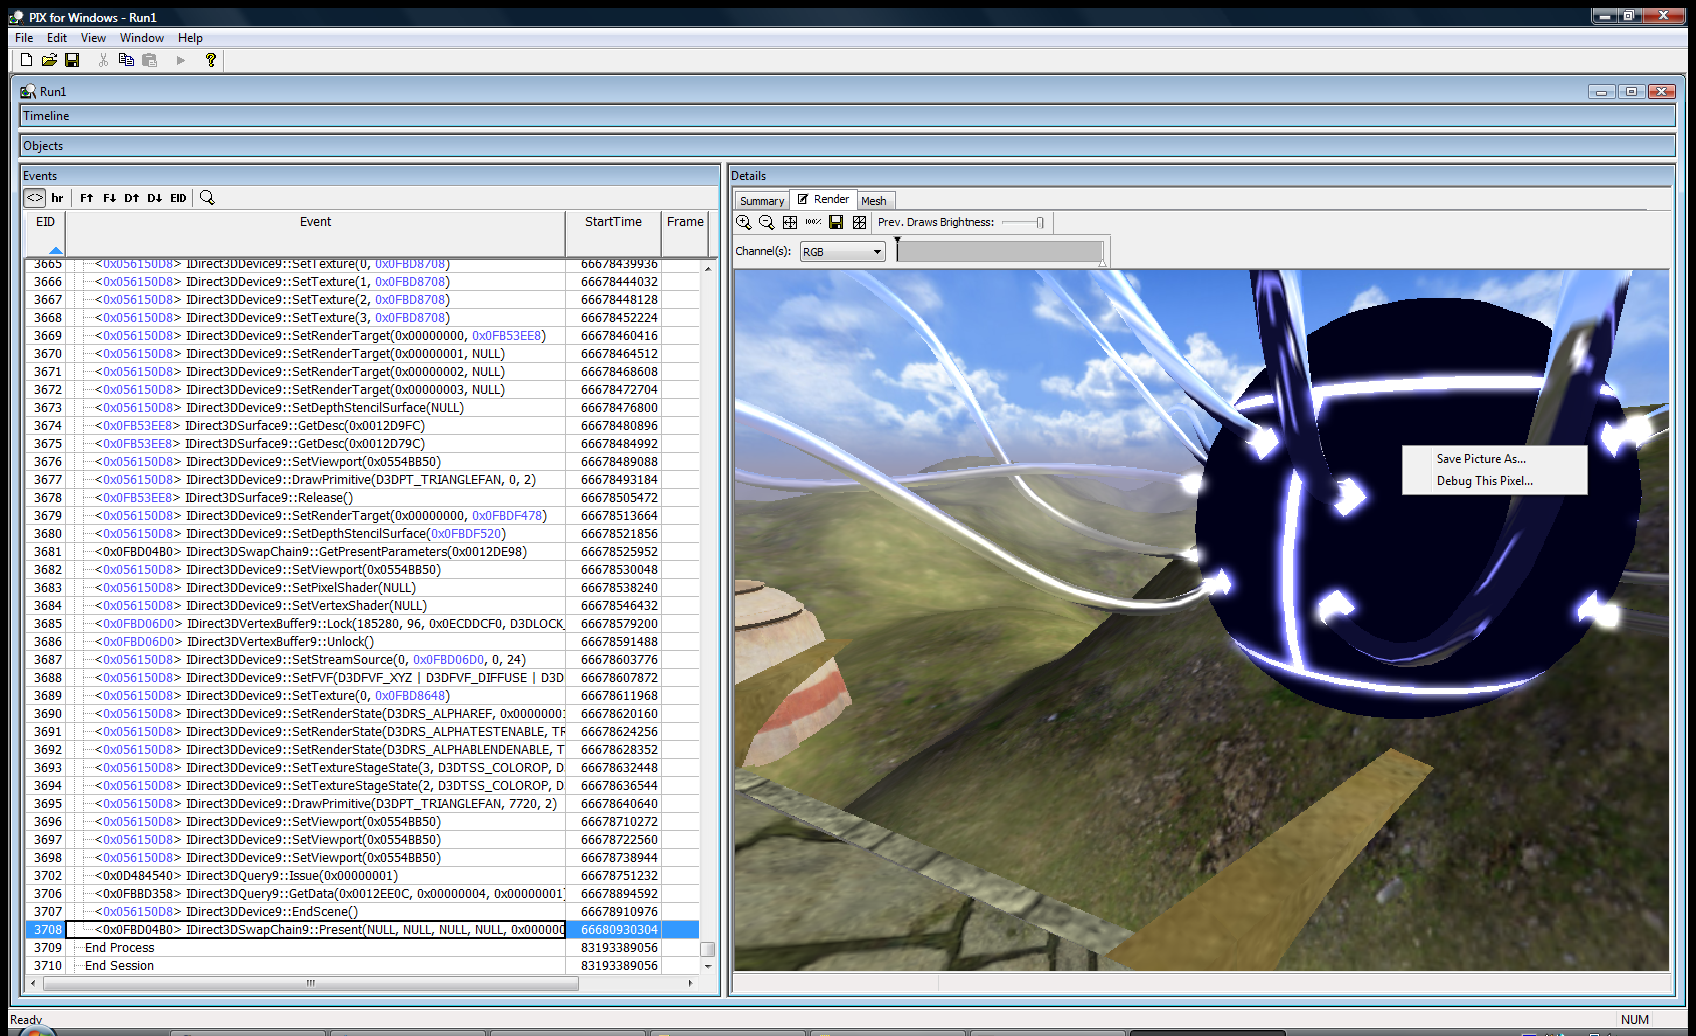
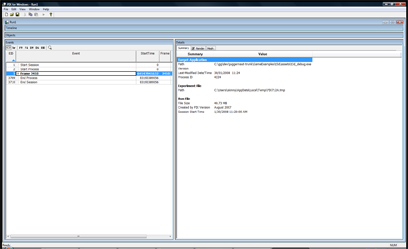
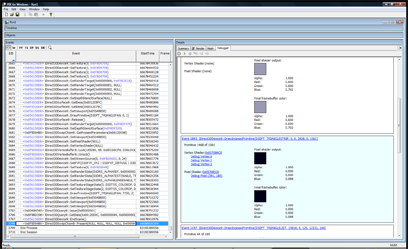
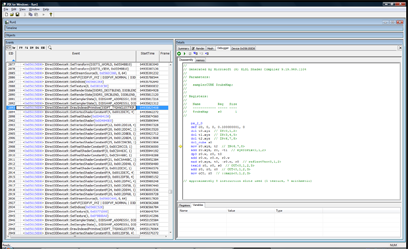
The “spider ball” in this image should be reflecting the tower it is next to, what gives? Let’s use PIX to figure it out. First, to launch PIX, find it under DirectX Utilities under the DX SDK folder. You’ll get a blank screen. Next, select File->New Experiment. Then for “Program Path”, enter the path to your executable. Then, select the “A single-frame capture to Direct3D whenever F12 is pressed.” radio button. Finally, hit the “Start Experiment”. This will launch the app. The next step is to get your app to render your bug. In this example, I moved the camera so I was looking at the spider ball again and hit the F12 key. The game will pause while PIX records all of the DirectX API calls and state into a log file. Then quit. You’ll end up with a screen like this:
The treeview in the lower left pane is a list of all DirectX calls made during the frame that was recorded. If you click on the render tab in the right pane PIX will show you the scene up to the API call selected in the left pane. You can learn a lot about how an app renders by just hitting the “D down” button and watching the scene draw step by step in the render pane.
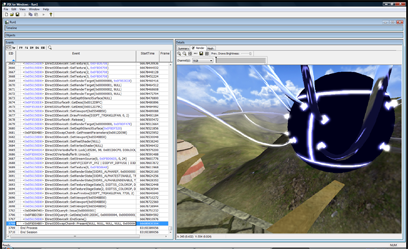
It’s cool to have all of this information at our fingertips, but it’d be cooler if we could filter it down to what we’re interested in. By right-clicking on a pixel in the scene and selecting “Debug This Pixel” we can do just that.
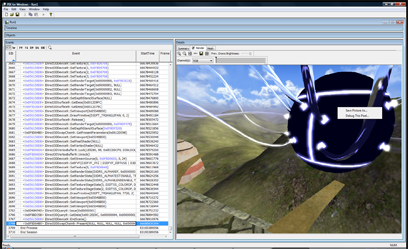
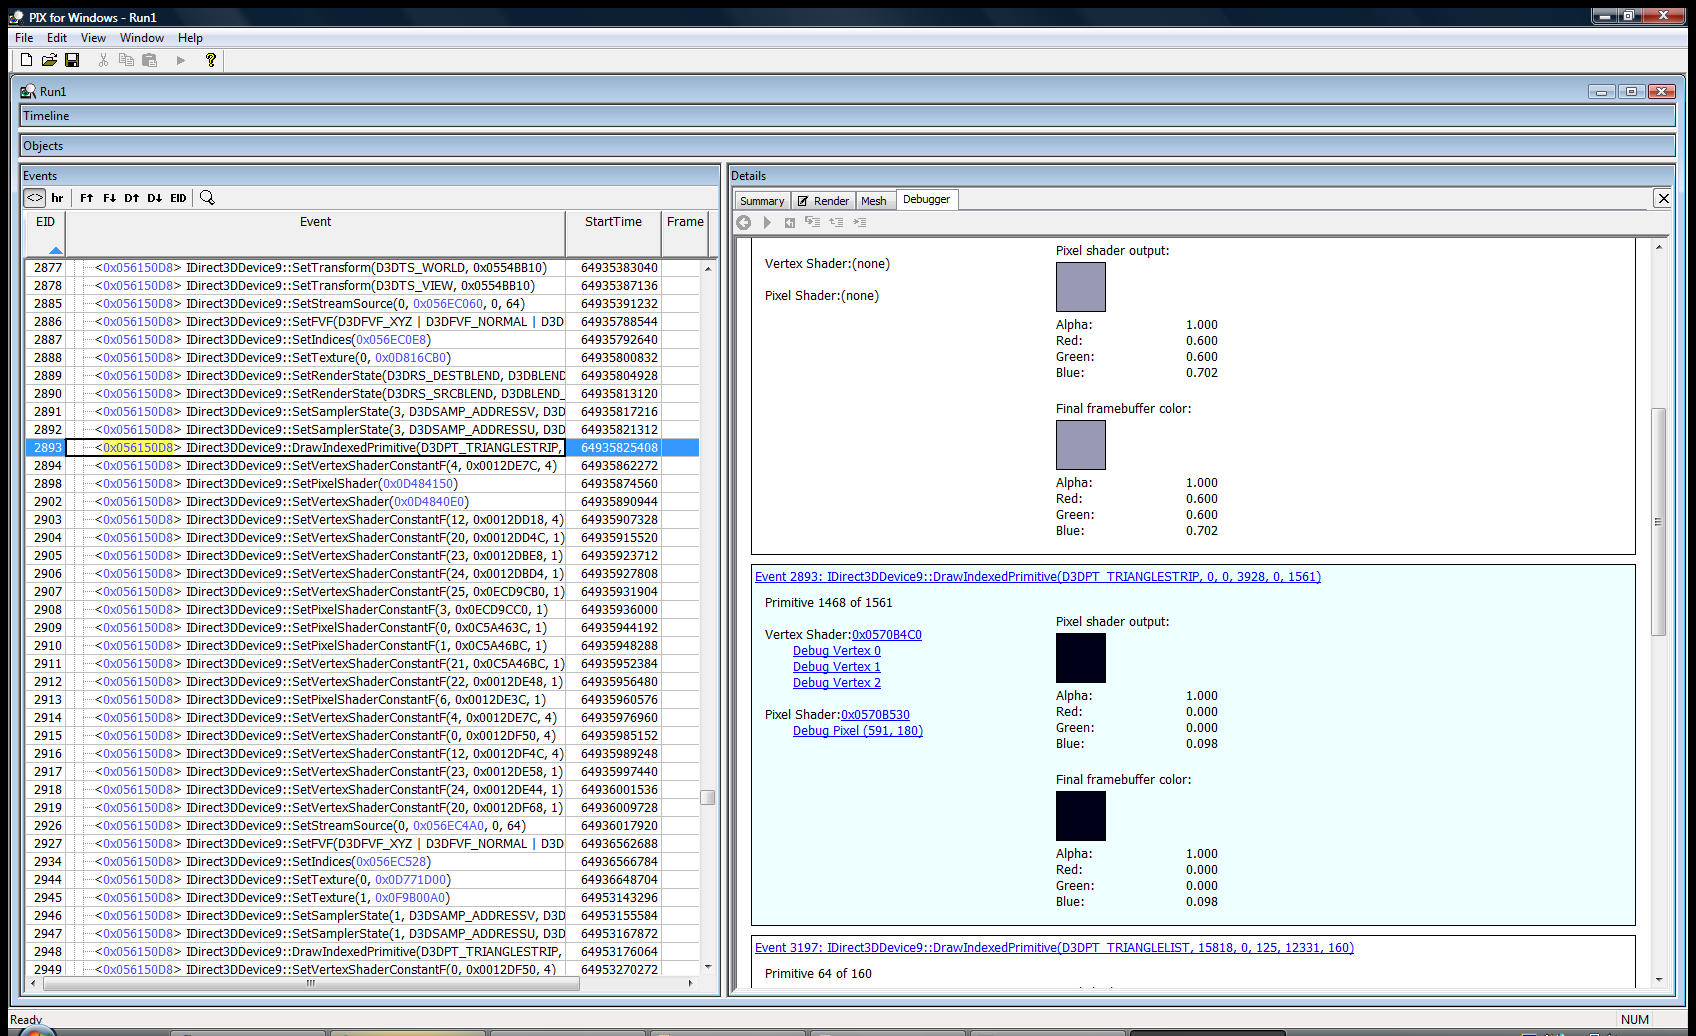
This will replace the render view with a list of all of the API calls that changed the color of that pixel. It’s a life story of that pixel for that frame. You can click on each of the links displayed to move the current selection in the treeview in the left hand pane to that API call.
In this next image, I just picked the first pixel that was black, which should get me to the API call I feel is generating the wrong image. It’s event 2893.
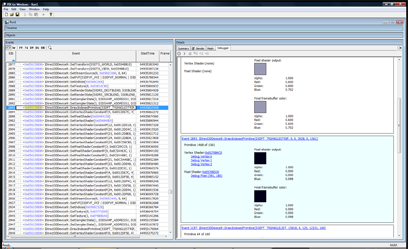
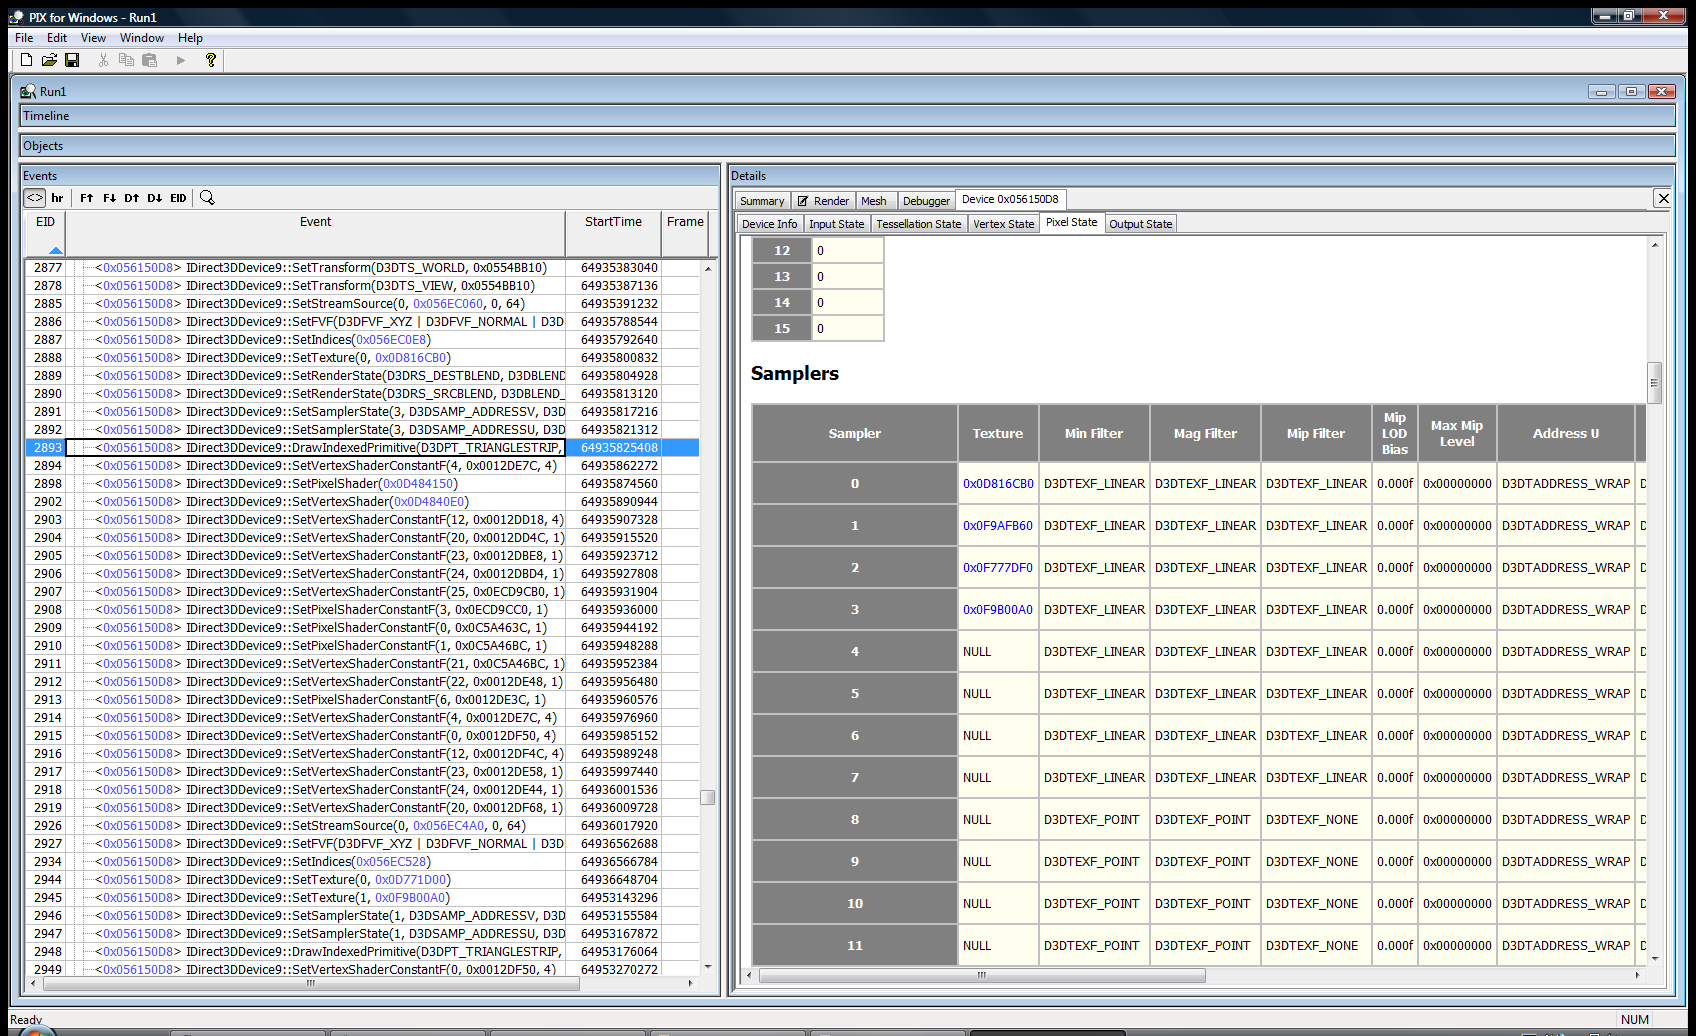
Now we can examine the state of D3D at the time of this call. This is awesome stuff! Rendering with DirectX (and OpenGL) basically involves setting up a large state machine. The types of states are rendering states, textures, texture sampling states, shaders, shader constants, and the list goes on. If any one of these states is incorrect, you’ll get rendering bugs. They can be hard to track down without a tool which allows one to examine the state of D3D. Often we have to do ad-hoc state checks by dumping textures to disk or querying the device and logging the state info out to a file. PIX provides the ability to check state without modifying your code. Getting back to my dynamic cubemap problem, the first question we must answer is: Is the dynamic cubemaptexture being rendered correctly? If it is being generated correctly, are we actually using it during the draw call? Let’s find out! Double click on the blue hexadecimal address to the left of the API call in the treeview in the left hand pane. In this example, it’s 0x056150D8. This will change the right hand pane to a view of the device. We can see a lot of state here. I want to look at the textures, so I choose “Pixel State” from the tabs and scroll down to the “Sampler” section. This section allows one to look at all of the current textures that are active during a draw call. Many bugs are just due to the wrong texture being bound, or no texture is bound at all!
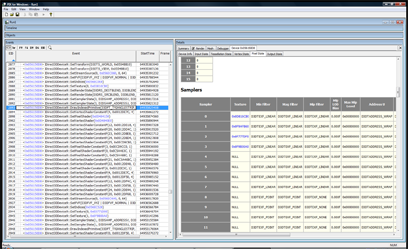
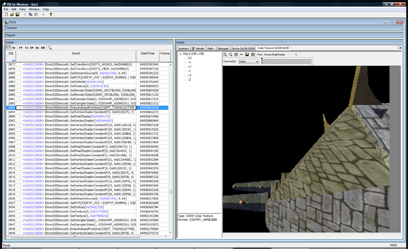
To actually look at the texture, just double click on the blue hexadecimal address in the “texture” column. In the next picture, you can see the cubemap texture has data in it! This is good news, that means I can ignore all of the code that deals with generating the cubemap.
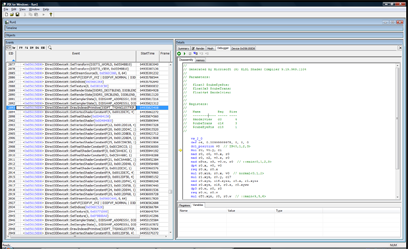
Next, I wanted to look at the pixel shader code that is used. Mostly because I forgot how the cubemap was working at the time. I wanted to see what other dependencies it might have: other textures, shader constants, etc. To do this, go back to the debugger frame that showed the history of the pixel and click on “Debug pixel (xx,xx)”. This will bring up the pixel shader that was used.
Looking at the shader, it only samples the cubemap and doesn’t rely on any shader constants. It’s time to look at the vertex shader to see what it passes to the pixel shader. To do this, just select “Debug Vertex X” in the history view.
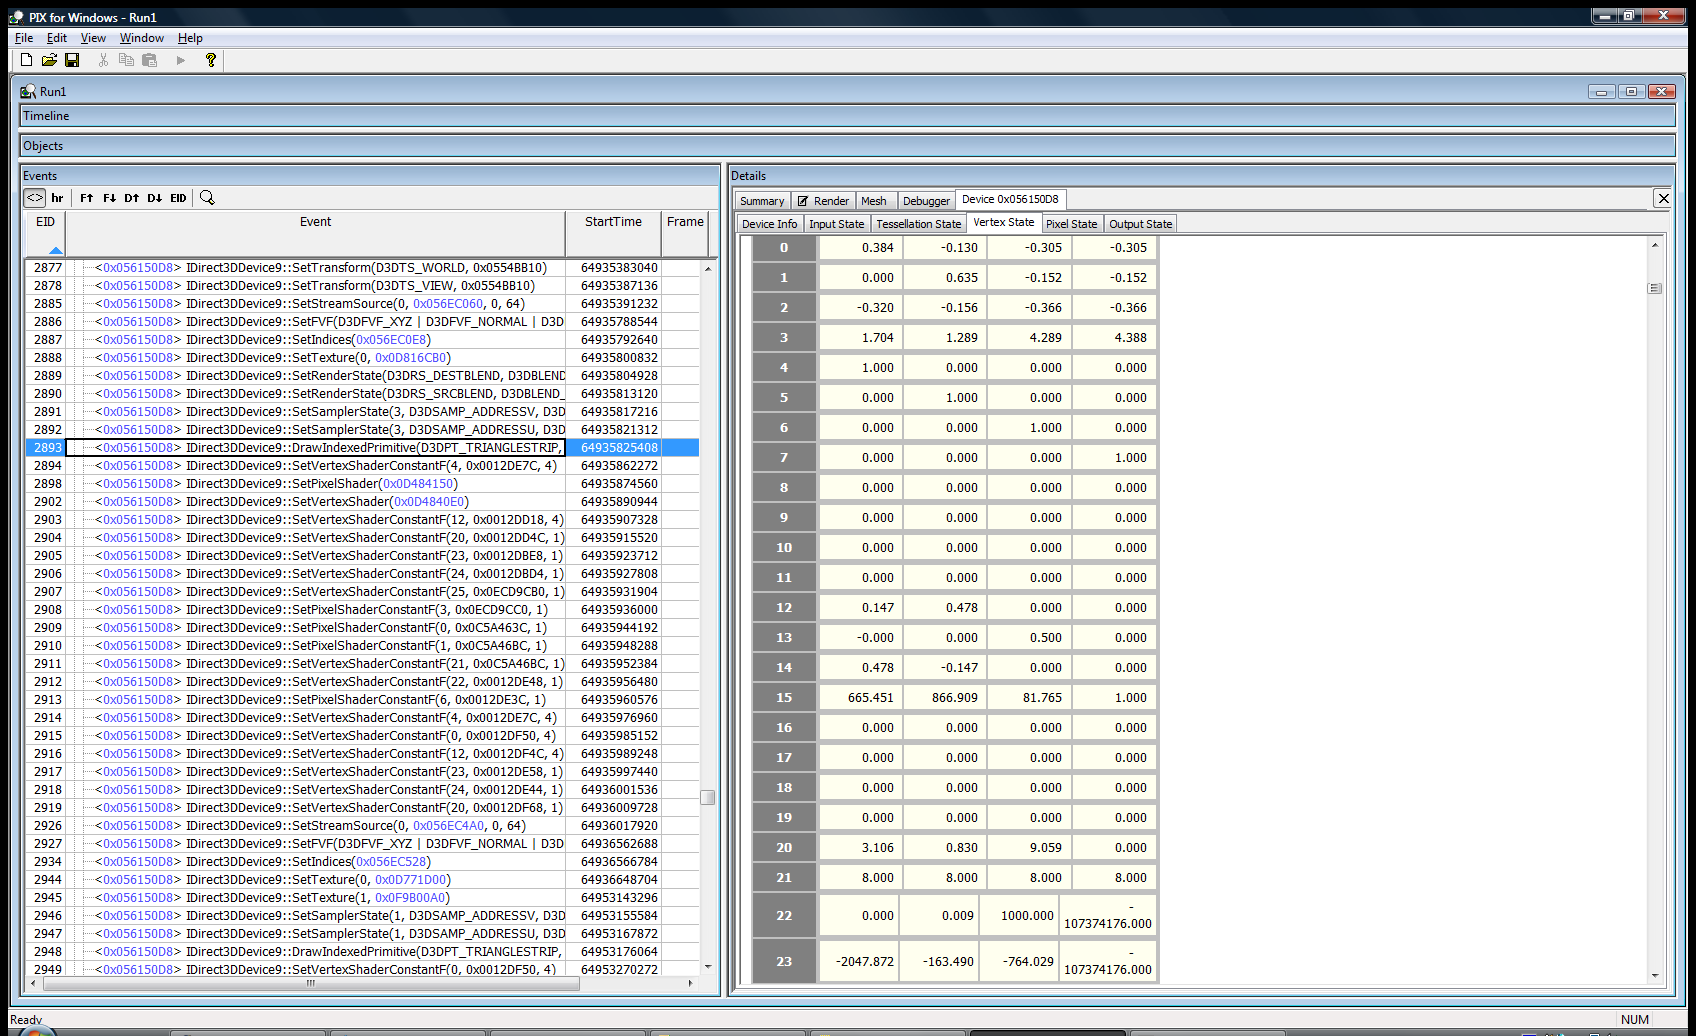
Looking at this dump really fast, I could see that it needed to have these vertex shader constants: $modelview @ position 0, $cubeTrans @ position 16, and $cubeEyePos @ position 19. Let’s check the vertex shader constants and see if the data is good. To do this, select “Vertex State” from the tabs and scroll down to the vertex shader constants.
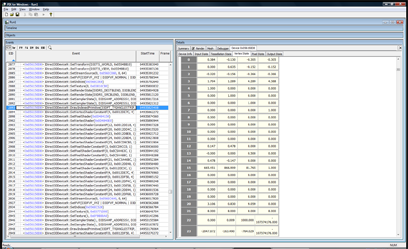
Oh crap! Look at positions 16-19, it’s full of zeros. So the cubemap transform isn’t getting set! I quickly searched the code to see what sets them up and found out that they’ll only be set if the material has “dynamicCubemap” set to true! D’oh! I fixed the material and got the following screen:
That was literally my debugging session, it took about 5 minutes. It could have taken a lot longer if I didn’t have the right tool. Hopefully, this was a good introduction to PIX. There are other uses for it: performance monitoring, resource usage, but this is what I use it for the most. I hope this article makes you reach for PIX the next time you have a rendering bug.
While working on Parallel Split Shadow Maps something that had been tripping me up was calculating the bounding box of a frustum in a light’s clipspace. I need this bounding box in order to scale the projection matrix to look at the piece of the scene that I’m interested in. I’ve noticed that other people have struggled with this problem as well, so I thought I’d post what I found.
My problem: So the problem I’m solving is this: Given a frustum in world space, find the bounding box of that frustum in the light’s clip space. My attack was this:
1. Translate each point of the frustum into light space. 2. Using the light’s projection matrix, translate this point into clipspace. 3. Project the point by dividing by the points .w coordinate. 4. Finally, check against the current min/max points (standard bounding box construction).
Which are the correct general steps. The problem is when a point that was one of the bounding boxes min/max points went behind the light, it wasn’t being counted correctly anymore? What gives?
Quick recap of clipspace/projection:
The clip matrix for D3D looks like this:
| xZoom 0 0 0 | | 0 yZoom 0 0 | | 0 0 (farPlane + nearPlane)/(farPlane - nearPlane) 1 | | 0 0 (nearPlane * farPlane)/(nearPlane - farPlane) 0 |
This basically allows for field of view (xZoom/yZoom) and near/far plane clipping. The goal of the matrix above is to scale x,y,z& w coordinates of a point to the values needed to project it to 2d and to provide clipping information. If 0 <= z <= w, then the point is within the near and far planes. This also works for the x & y coordinates by comparing against -w and w.
For my problem, we can simpify this matrix down to this:
| 1 0 0 0 | | 0 1 0 0 | | 0 0 1 1 | | 0 0 0 0 |
Which turns projection into just dividing x & y by z. This is the way most of us did 3d when we were little kids.
The issue was my mental model of projection was wrong. I basically thought of it as a flattening operation. That is true when the points are all in front of the camera, but when points are behind the camera the x & y coordinates will actually get mirrored due to the z coordinate being negative! So if z = -1 then it’s going to flip x & y, duh!
In my case, I needed to use the absolute value of the w to get the number I needed. I doubt this is an issue that will come up often for people, but I just thought I’d share what I learned by repeating smashing my head against this problem. ;)
Notes: Here’s the slide-deck that triggered this in my head: http://www.terathon.com/gdc07_lengyel.ppt
Slide 7 has a great graphic, basically, the red area is the flipped coordinates.
Example: In front of the camera: untranslated: -10.000000 100.000000 0.000000 1.000000 clipspace: -10.000000 -0.000006 99.909988 100.000000 normalized device coords: -0.100000 -0.000000 0.999100
Behind the camera: untranslated: -10.000000 -100.000000 0.000000 1.000000 clipspace: -10.000000 0.000006 -100.110016 -100.000000 normalized device coords: 0.100000 -0.000000 1.001100
You can see that behind the camera the x&y coordinates are flipped!
Here’s the code for the above little experiment:
void testProj(Point4F testPt) { MatrixF proj(GFX->getProjectionMatrix()); Con::printf(“untranslated: %f %f %f %f”, testPt.x, testPt.y, testPt.z, testPt.w); proj.mul(testPt); Con::printf(“clipspace: %f %f %f %f”, testPt.x, testPt.y, testPt.z, testPt.w); testPt.x /= testPt.w; testPt.y /= testPt.w; testPt.z /= testPt.w; Con::printf(“normalized device coords: %f %f %f”, testPt.x, testPt.y, testPt.z); }
Point4F inFrontOfCamera(-10.0f, 100.0f, 0.0f, 1.0f); Point4F behindOfCamera(-10.0f, -100.0f, 0.0f, 1.0f); Con::printf(“infront”); testProj(inFrontOfCamera); Con::printf(“behind”); testProj(behindOfCamera);
Here’s another older article that I reckon I should just get out of the queue. As a pretty hardcore Visual Studio user, my initial experience with XCode was awful. After using it for a while, XCode isn’t so bad. I still prefer VS as it’s more mature, but here are things that I had problems with and fixed:
Problem: It opened more windows than I can keep track of. Answer: Turn on the three pane mode. **Problem:**I was unable to figure out the auto-complete keyboard code! I asked two or three different Mac people, and no-one understood the circle icon which was supposed to be the keyboard shortcut. **Answer:**It’s the Escape key! So much for being intuitive!
Random neat things about XCode!
- Ctrl-Apple up will toggle between the header and source file. This is something I’ve always wanted in VS (I know there are macros to do it). Delphi IDE’s was really good about jumping between the implementation and interface of a class.
Not so neat things:
- I haven’t used the debugger to much, but it doesn’t seem to let you right-click on a file global and add a watch. You must go through the global variable tree. It always loses these watches between invocations which is annoying.
To break up all of the high score posts, I’m just going to publish this old thing I never finished. I think it’s a good starting point for a good article or something. Every developer gets dumped into a large codebase they don’t know anything about at one point or another in their life. Torque has 1.3 million lines of code spread out over 2800 files, not including TorqueScript. The Windows XP tree is estimated to have 40 million lines of code.
How are you supposed to comprehend something this large?
The answer is simple. You don’t. It’s likely you’ll never know exactly how the whole system works. Even the people that wrote it will not know over time. The best you can do is create a model about how each of the pieces of the system work and correct this model as you debug and learn more about it. I asked a guy during an interview how he explores a new body of code. His response was that he liked to look at every file and function and see how it all works. Can you imagine trying to do that to Windows XP? You’d never have time to write new code!
How does one build a model of an application? I usually start by simply using it for a while. The goal is to grasp what the major bodies of functionality are. The next step is to pick a small modification and figure out how to implement it. Then you start using the tools below to figure out how to do it. The reason for this is to create a filter in which you can start examining the source code. Without it, you’re just staring at a huge monster with no weapons to attack it!
Grep and Find in Files. This is probably the best tool for doing this kind of exploring. Most of the other tools are just refinements of this. Just start searching for keywords that are similar to your modification. If you’re working on a GUI library and your modification is to create a “SuperButton”. Just do a grep for “Button” through the source tree. You’re likely to get waaay too many hits for a simple query like that. This is where you turn to regular expressions. Change your search to “class.*Button” to find out where the Button (or descendant class) are implemented, assuming C++ as the target language.
Go to definition. This is in Visual Studio and Eclipse. You can right click on any symbol and select “Go to definition”. This will take you where the class or function is defined. A shortcut for above. Get callers (Eclipse) , or Find All References (Visual Studio) This lets you see what uses a particular object/method. Useful to figure out code flow/structure and to figure out how large of an effort changing that object/method will be. Breakthings! I love just commenting out large bodies of code and watching the effects on the system. This is a great way to validate assumptions about what a body of code does. I just recently confirmed I was looking at the wrong piece of code by commenting it out and not seeing the effect I expected. Remember Project forces. The reasons behind why a particular piece of code was written are rarely purely techinical. Some pieces of the system may have been written under different time constraints, different goals that do not apply anymore, or just different coding philosophies at the time. Keep this in mind while mining through a new codebase, it will help understanding of the code (and also of the team that wrote it).
A good day so far: Gave my two weeks of notice today. It was hard to do because this is a cool place to work. But I’ll be making games soon, so that’s even cooler! Also, a new Robotron highscore today: 413850. I talked to a guy at PAGDIG (http://www.pagdig.org) who met Eugene Jarvis the creator of Robotron. Apparently, he asks if you break a million. So that’s definitely my new goal. More content soon, I hope! ;)

I got these a while ago and have been too lazy to post. Q*Bert: 137320, Robotron: 387875


Still need to work on my homebrew Wii robotron clone. I have a “player” working. Need to get hit detection and enemies on the screen next.
I’ve got free time again and I want to try out some homebrew console development. I’ve got a Wii, so I’m looking at GameCube homebrew for now. The steps as I see them are:
- Get someone elses homebrew working on my system.
- Get a dev environment setup, compile someone elses stuff and run it.
- Write some silly stuff of my own (I’m thinking Robotron ripoff)
- Profit!
I’ve got step 1 done. I bought a Datel SD Media launcher which allows one to load .dol and .bin files off of a SD card. I’m curious how the Datel CD is bootable by the Wii. How’d they pull that off? I also got some cheapo Gamecube controllers and downloaded some ROM’s from here: http://www.dcemu.co.uk/vbulletin/showthread.php?t=48442
So now I’m onto steps 2 & 3, this is my launchpad for that: http://www.tehskeen.com/forums/showthread.php?t=2968
Update: Neat, that didn’t take very long to do. I was expecting quite a fight to get a dev environment running for some reason. Onto step 3!
118420!

I got this new disc from Not BreathingThis disc is awesome. The great tracks on the disc are Dead Voices on Acetone and the crazy one about treating your mom right (What’cha Mom Wearing).
I also get a random bonus prize with my disc:
 It’s some random ass circuit board that looks like it used to plug into something judging by the traces at the bottom. This is why it’s best to order direct from the creator. ;)